Bitget:全球日交易量排名前 4!
BTC 市占率61.35%
Bitget 新幣上架 : Pi Network
BTC/USDT$82422.00 (+0.27%)恐懼與貪婪指數32(恐懼)
山寨季指數:0(比特幣季)
盤前交易幣種PAWS,WCT比特幣現貨 ETF 總淨流量:-$93.2M(1 天);+$445.2M(7 天)。Bitget 新用戶立享 6,200 USDT 歡迎禮包!立即領取
到 Bitget App 隨時隨地輕鬆交易!立即下載
Bitget:全球日交易量排名前 4!
BTC 市占率61.35%
Bitget 新幣上架 : Pi Network
BTC/USDT$82422.00 (+0.27%)恐懼與貪婪指數32(恐懼)
山寨季指數:0(比特幣季)
盤前交易幣種PAWS,WCT比特幣現貨 ETF 總淨流量:-$93.2M(1 天);+$445.2M(7 天)。Bitget 新用戶立享 6,200 USDT 歡迎禮包!立即領取
到 Bitget App 隨時隨地輕鬆交易!立即下載
Bitget:全球日交易量排名前 4!
BTC 市占率61.35%
Bitget 新幣上架 : Pi Network
BTC/USDT$82422.00 (+0.27%)恐懼與貪婪指數32(恐懼)
山寨季指數:0(比特幣季)
盤前交易幣種PAWS,WCT比特幣現貨 ETF 總淨流量:-$93.2M(1 天);+$445.2M(7 天)。Bitget 新用戶立享 6,200 USDT 歡迎禮包!立即領取
到 Bitget App 隨時隨地輕鬆交易!立即下載


Fuel Network 價格FUEL
上架
報價幣種:
TWD
NT$0.3906+4.13%1D
價格走勢圖
TradingView
最近更新時間 2025-03-30 17:42:19(UTC+0)
市值:NT$1,738,621,511.77
完全稀釋市值:NT$1,738,621,511.77
24 小時交易額:NT$227,541,606.67
24 小時交易額/市值:13.08%
24 小時最高價:NT$0.4279
24 小時最低價:NT$0.3730
歷史最高價:NT$2.8
歷史最低價:NT$0.3307
流通量:4,451,279,400 FUEL
總發行量:
10,076,347,287.79FUEL
流通率:44.00%
最大發行量:
--FUEL
以 BTC 計價:0.{6}1426 BTC
以 ETH 計價:0.{5}6515 ETH
以 BTC 市值計價:
NT$12,207
以 ETH 市值計價:
NT$1,624.94
合約:
0x675B...192079c(Ethereum)
更多
您今天對 Fuel Network 感覺如何?
注意:此資訊僅供參考。
Fuel Network 今日價格
Fuel Network 的即時價格是今天每 (FUEL / TWD) NT$0.3906,目前市值為 NT$1.74B TWD。24 小時交易量為 NT$227.54M TWD。FUEL 至 TWD 的價格為即時更新。Fuel Network 在過去 24 小時內的變化為 4.13%。其流通供應量為 4,451,279,400 。
FUEL 的最高價格是多少?
FUEL 的歷史最高價(ATH)為 NT$2.8,於 2024-12-29 錄得。
FUEL 的最低價格是多少?
FUEL 的歷史最低價(ATL)為 NT$0.3307,於 2025-03-13 錄得。
Fuel Network 價格預測
FUEL 在 2026 的價格是多少?
根據 FUEL 的歷史價格表現預測模型,預計 FUEL 的價格將在 2026 達到 NT$0.6441。
FUEL 在 2031 的價格是多少?
2031,FUEL 的價格預計將上漲 +1.00%。 到 2031 底,預計 FUEL 的價格將達到 NT$1.3,累計投資報酬率為 +230.55%。
Fuel Network 價格歷史(TWD)
過去一年,Fuel Network 價格上漲了 -77.15%。在此期間,FUEL 兌 TWD 的最高價格為 NT$2.8,FUEL 兌 TWD 的最低價格為 NT$0.3307。
時間漲跌幅(%) 最低價最高價
最低價最高價 24h+4.13%NT$0.3730NT$0.4279
7d-23.18%NT$0.3427NT$0.5042
30d+7.04%NT$0.3307NT$0.5707
90d-83.78%NT$0.3307NT$2.61
1y-77.15%NT$0.3307NT$2.8
全部時間-41.15%NT$0.3307(2025-03-13, 18 天前 )NT$2.8(2024-12-29, 92 天前 )
Fuel Network 市場資訊
Fuel Network 行情
Fuel Network 持幣
Fuel Network 持幣分布矩陣
Fuel Network 持幣分布集中度
巨鯨
投資者
散戶
Fuel Network 地址持有時長分布
長期持幣者
游資
交易者
coinInfo.name(12)即時價格表

Fuel Network 評級
社群的平均評分
4.3
此內容僅供參考。
FUEL 兌換當地法幣匯率表
1 FUEL 兌換 MXN$0.241 FUEL 兌換 GTQQ0.091 FUEL 兌換 CLP$10.941 FUEL 兌換 UGXSh42.631 FUEL 兌換 HNLL0.31 FUEL 兌換 ZARR0.221 FUEL 兌換 TNDد.ت0.041 FUEL 兌換 IQDع.د15.421 FUEL 兌換 TWDNT$0.391 FUEL 兌換 RSDдин.1.271 FUEL 兌換 DOP$0.741 FUEL 兌換 MYRRM0.051 FUEL 兌換 GEL₾0.031 FUEL 兌換 UYU$0.51 FUEL 兌換 MADد.م.0.111 FUEL 兌換 AZN₼0.021 FUEL 兌換 OMRر.ع.01 FUEL 兌換 SEKkr0.121 FUEL 兌換 KESSh1.511 FUEL 兌換 UAH₴0.48
- 1
- 2
- 3
- 4
- 5
最近更新時間 2025-03-30 17:42:19(UTC+0)
如何購買 Fuel Network(FUEL)

建立您的免費 Bitget 帳戶
使用您的電子郵件地址/手機號碼在 Bitget 註冊,並建立強大的密碼以確保您的帳戶安全

認證您的帳戶
輸入您的個人資訊並上傳有效的身份照片進行身份認證

將 Fuel Network 兌換為 FUEL
我們將為您示範使用多種支付方式在 Bitget 上購買 Fuel Network
了解更多交易 FUEL 永續合約
在 Bitget 上註冊並購買 USDT 或 FUEL 後,您可以開始交易衍生品,包括 FUEL 合約和槓桿交易,增加收益。
FUEL 的目前價格為 NT$0.3906,24 小時價格變化為 +4.13%。交易者可透過做多或做空 FUEL 合約獲利。
Fuel Network 動態
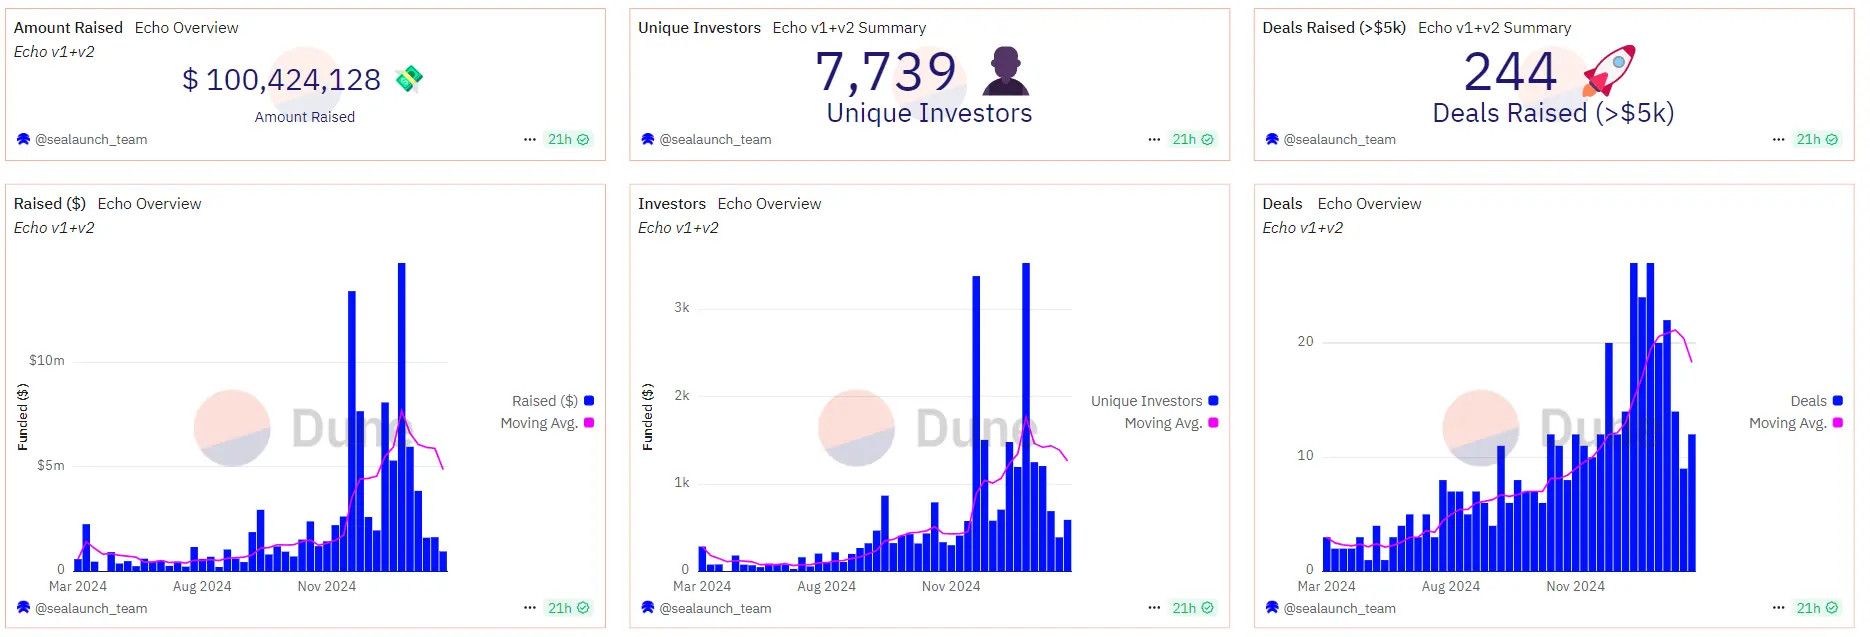
平均回報率達 400%,這三個收益超高的加密 IDO 平台你都知道嗎?
加密社區對“高估值、高 FDV、低流通量”的 VC 幣早已不滿,IDO 成為項目方吸引社區支持的熱門選擇,這也推動了 Echo、Legion、Buidlpad 等新興 IDO 平台的崛起。
Chaincatcher•2025-02-27 13:00
Bitget LaunchX 支持 Jambo 為衛星發射計劃籌集 500 萬美元
Zombit•2025-01-18 01:55

Bitget LaunchX 支持 Jambo 為衛星發射計劃籌集 500 萬美元
Abmedia•2025-01-17 20:00
FUELUSDT 現已上架合約交易和交易BOT
Bitget Announcement•2025-01-02 05:00

購買其他幣種


用戶還在查詢 Fuel Network 的價格。
Fuel Network 的目前價格是多少?
Fuel Network 的即時價格為 NT$0.39(FUEL/TWD),目前市值為 NT$1,738,621,511.77 TWD。由於加密貨幣市場全天候不間斷交易,Fuel Network 的價格經常波動。您可以在 Bitget 上查看 Fuel Network 的市場價格及其歷史數據。
Fuel Network 的 24 小時交易量是多少?
在最近 24 小時內,Fuel Network 的交易量為 NT$227.54M。
Fuel Network 的歷史最高價是多少?
Fuel Network 的歷史最高價是 NT$2.8。這個歷史最高價是 Fuel Network 自推出以來的最高價。
我可以在 Bitget 上購買 Fuel Network 嗎?
可以,Fuel Network 目前在 Bitget 的中心化交易平台上可用。如需更詳細的說明,請查看我們很有幫助的 如何購買 fuel-network 指南。
我可以透過投資 Fuel Network 獲得穩定的收入嗎?
當然,Bitget 推出了一個 策略交易平台,其提供智能交易策略,可以自動執行您的交易,幫您賺取收益。
我在哪裡能以最低的費用購買 Fuel Network?
Bitget提供行業領先的交易費用和市場深度,以確保交易者能够從投資中獲利。 您可通過 Bitget 交易所交易。
您可以在哪裡購買 Fuel Network(FUEL)?
影片部分 - 快速認證、快速交易

如何在 Bitget 完成身分認證以防範詐騙
1. 登入您的 Bitget 帳戶。
2. 如果您是 Bitget 的新用戶,請觀看我們的教學,以了解如何建立帳戶。
3. 將滑鼠移到您的個人頭像上,點擊「未認證」,然後點擊「認證」。
4. 選擇您簽發的國家或地區和證件類型,然後根據指示進行操作。
5. 根據您的偏好,選擇「手機認證」或「電腦認證」。
6. 填寫您的詳細資訊,提交身分證影本,並拍攝一張自拍照。
7. 提交申請後,身分認證就完成了!
加密貨幣投資(包括透過 Bitget 線上購買 Fuel Network)具有市場風險。Bitget 為您提供購買 Fuel Network 的簡便方式,並且盡最大努力讓用戶充分了解我們在交易所提供的每種加密貨幣。但是,我們不對您購買 Fuel Network 可能產生的結果負責。此頁面和其包含的任何資訊均不代表對任何特定加密貨幣的背書認可,任何價格數據均採集自公開互聯網,不被視為來自Bitget的買賣要約。
Bitget 觀點

Bushra_Jabeen32
1小時前
$ PARTI
Navigating the $PARTI Tides: Understanding Price Fluctuations and Strategic Investment Windows
The $PARTI token, representing the Particle Network, operates within the volatile yet potentially lucrative cryptocurrency market. Recognizing the patterns of its price fluctuations and pinpointing strategic investment periods is crucial for any investor seeking to capitalize on its potential.
Understanding $PARTI's Price Volatility:
$PARTI, like all digital assets, experiences price swings driven by a complex interplay of factors:
* Market Sentiment and Hype:
* The cryptocurrency market is heavily influenced by online discourse, news cycles, and overall investor confidence. Positive buzz can trigger rapid price surges, while negative sentiment can lead to sharp declines.
* Technological Developments and Adoption:
* Particle Network's progress in developing and deploying its technology directly impacts $PARTI's value. Successful partnerships, platform updates, and increased user adoption can fuel price appreciation.
* Supply and Demand Dynamics:
* The circulating supply of $PARTI, its total supply, and the level of investor demand all contribute to price fluctuations. Understanding the token's distribution and potential scarcity is essential.
* Broader Cryptocurrency Market Trends:
* $PARTI's price is often correlated with the movements of major cryptocurrencies like Bitcoin and Ethereum. General market trends, regulatory changes, and macroeconomic factors can all influence its trajectory.
* Speculative Trading and Whale Activity:
* The crypto market attracts a significant amount of speculative trading, leading to rapid and unpredictable price movements. Large buy or sell orders from whales (large holders) can also create significant price swings.
* Project Related News:
* Any news relating to the Particle Network itself, such as partnership announcements, or technological breakthroughs, will greatly effect the $PARTI tokens price.
Identifying Strategic Investment Windows:
Pinpointing the optimal time to invest in $PARTI requires a thoughtful approach. While predicting the future with absolute certainty is impossible, here are some strategies:
* Dollar-Cost Averaging (DCA):
* This involves investing a fixed amount of capital at regular intervals, regardless of the price. DCA can mitigate the impact of volatility and reduce the risk of buying at a market peak.
* Dip Buying and Support Levels:
* Identifying periods of price corrections or dips, particularly when the price approaches established support levels, can present opportunities to buy $PARTI at a discount. However, confirm that the dip isn't a long-term downtrend.
* Trend Analysis and Breakout Points:
* Analyzing price charts and technical indicators can help identify potential trend reversals or breakout points. Investing during an established uptrend can increase the likelihood of profits.
* Fundamental Analysis and Project Milestones:
* Investing when the Particle Network achieves significant milestones, such as successful platform updates or strategic partnerships, can be a favorable strategy.
* Long-Term Vision and Hodling:
* If you have a strong belief in the long-term potential of the Particle Network, holding $PARTI for an extended period can potentially yield substantial returns, despite short-term volatility.
Key Considerations:
* The cryptocurrency market is inherently volatile, and any investment carries significant risk.
* Thorough research and risk management are paramount.
* It is very important to make sure to research the specific $PARTI token, as other tokens may share similar ticker symbols.
FUEL-2.55%
HYPE-2.81%

Smith001
2小時前
Is $IMT Set for a Bullish Run? A Deep Dive into Recent Price Action
Cryptocurrencies are notorious for their volatility, and $IMT (the token in question) is no exception. However, analyzing recent price action, coupled with key technical indicators, upcoming developments, and market sentiment, can offer valuable insights into whether $IMT is on the verge of a bullish run. A bullish run refers to a period of sustained upward price movement driven by positive catalysts, strong market interest, and favorable technical conditions. This analysis will break down the key factors that could contribute to $IMT's potential for a bullish breakout and what traders and investors should watch for.
1. Recent Price Action: A Key Indicator of Future Movements
The first step in assessing whether $IMT is poised for a bullish run is to examine its recent price action. Understanding how the token has performed in the short term is essential for identifying trends, key levels of support and resistance, and whether the market is currently leaning bullish or bearish.
a) Price Consolidation and Accumulation
Over the past few weeks or months, if $IMT has been experiencing periods of consolidation (sideways price movement) after a previous correction, this could be a sign of accumulation. Accumulation refers to the phase when strong hands (long-term investors or whales) are buying the token at lower prices, preparing for a potential breakout.
Consolidation typically occurs after a sharp decline or a period of high volatility, as the market digests previous price movements and stabilizes. If $IMT has held its ground above key support levels, this may indicate that buyers are accumulating positions in anticipation of a bullish move.
b) Breakout Above Key Resistance Levels
A breakout occurs when the price of $IMT moves above a key resistance level, signaling a potential shift in market sentiment. Resistance levels are price points where selling pressure has historically been strong, preventing the price from moving higher.
If $IMT has recently broken above significant resistance (such as previous highs or technical price zones like the 50-day or 200-day moving averages), it could indicate that the token is entering a new upward trend. A breakout above resistance often attracts additional buying pressure, which could propel the price higher in the coming days or weeks.
c) Volume Surge
An increase in trading volume often accompanies bullish price movements. When a price breaks resistance or enters a new uptrend, a corresponding surge in volume is a sign that there is strong market interest and momentum behind the move. Volume provides a confirmation signal, ensuring that the move isn't just a temporary spike or "false breakout."
If $IMT has seen higher-than-average volume during recent price rises, this could be a strong indication that institutional investors, whales, or retail traders are entering the market, fueling a potential bullish run.
2. Key Technical Indicators Pointing to a Bullish Trend
Technical analysis relies on several indicators to assess whether an asset is in a bullish or bearish phase. For $IMT, certain indicators might confirm the likelihood of a bullish run:
a) Moving Averages
Golden Cross: One of the most bullish technical patterns is the Golden Cross, which occurs when the short-term moving average (e.g., 50-day moving average) crosses above the long-term moving average (e.g., 200-day moving average). This signals that the short-term momentum is now stronger than the long-term trend, indicating the potential for further price increases.
If $IMT has experienced a Golden Cross, it could suggest that the market sentiment has shifted from bearish to bullish, creating the perfect environment for a sustained upward move.
b) Relative Strength Index (RSI)
The Relative Strength Index (RSI) is a momentum oscillator that measures whether an asset is overbought or oversold. An RSI above 70 indicates that the asset may be overbought and could experience a pullback, while an RSI below 30 suggests that the asset is oversold and may be due for a price rebound.
If $IMT’s RSI is in the neutral zone (40-60) and begins to trend upward, this could signal strengthening bullish momentum. A rise in RSI above 50 typically indicates that buying pressure is building, and a potential bullish trend could be in motion.
c) MACD (Moving Average Convergence Divergence)
The MACD is another momentum indicator that tracks the difference between two moving averages: the 12-day and 26-day exponential moving averages (EMA). A bullish crossover occurs when the MACD line crosses above the signal line, signaling the potential for upward price movement.
If $IMT’s MACD has recently crossed above its signal line, this could confirm that positive momentum is building, potentially marking the beginning of a bullish trend.
d) Support and Resistance Levels
Identifying key support and resistance levels is critical in determining whether $IMT is poised for a bullish run. If $IMT has recently found support at a key level (such as the 50-day or 200-day moving averages or a horizontal support zone) and is now testing or breaking through previous resistance levels, it suggests that buyers are stepping in, ready to push the price higher.
Furthermore, if $IMT holds above support and respects key demand zones, it can signal to traders that the market is strong enough to sustain a bullish breakout.
3. Upcoming Developments and News Catalysts
While technical indicators can point to potential price movements, upcoming developments can serve as powerful catalysts for a bullish run in the cryptocurrency market.
a) Partnerships and Collaborations
Strategic partnerships and collaborations with major companies, platforms, or blockchain ecosystems can significantly enhance the utility and adoption of $IMT, leading to a surge in demand for the token. For example, if $IMT partners with a well-known financial institution, decentralized finance (DeFi) protocol, or tech company, it could trigger excitement in the market and increase buying pressure.
Exchange listings are also major bullish catalysts. If $IMT gets listed on a major exchange like Binance or Coinbase, this often leads to increased liquidity, visibility, and demand, which can further fuel a price surge.
b) Product Launches and Technological Upgrades
Upcoming product launches, new features, or technological advancements within the $IMT ecosystem can also boost investor sentiment. For example, if the team behind $IMT is rolling out new functionalities like improved transaction speeds, staking options, or decentralized applications (dApps) that add significant utility, this can create a positive outlook for the future of the token.
Any announcement related to blockchain scaling solutions or a major technical milestone could excite the community and lead to a bullish surge in price.
c) Regulatory Clarity
As the cryptocurrency market matures, regulatory clarity plays a vital role in shaping investor confidence. If $IMT operates in a jurisdiction that is moving toward clearer regulations that benefit cryptocurrencies, such as favorable taxation or compliance frameworks, this could signal stability and legitimacy, attracting institutional investors and retail buyers.
Positive regulatory news can diminish uncertainty, driving prices upward as more investors feel comfortable engaging with the asset.
4. Market Sentiment and Broader Cryptocurrency Trends
Even though $IMT’s individual price action is crucial, it’s important to consider the broader market sentiment. Cryptocurrencies tend to follow trends set by major assets like Bitcoin (BTC) and Ethereum (ETH), especially during periods of volatility or uncertainty.
a) Bitcoin and Ethereum Performance
If Bitcoin is in a strong bullish phase, it often leads the market and influences altcoins like $IMT. If Bitcoin moves into a price discovery phase, breaking through previous all-time highs, altcoins often follow suit and experience a positive price reaction.
Additionally, Ethereum’s developments and adoption (e.g., Ethereum 2.0 upgrades) can significantly affect the broader crypto market, including smaller tokens like $IMT.
b) General Market Optimism
General market optimism around the future of blockchain technology, DeFi, or NFTs can create a ripple effect, causing many cryptocurrencies, including $IMT, to experience price increases.
If there’s a renewed interest in decentralized finance or non-fungible tokens, projects connected to these sectors may see an influx of capital, leading to a bullish rally.
5. Risk Factors to Consider
While there are several positive indicators that suggest $IMT could be set for a bullish run, it’s essential to also account for potential risks:
Market Corrections: Cryptocurrencies are volatile, and even in a bullish environment, the market can experience short-term corrections that pull prices down temporarily.
Negative News: Unexpected events, such as regulatory crackdowns, security breaches, or project-related issues, can negatively impact the sentiment and cause a sharp decline in price.
Overbought Conditions: If $IMT’s RSI or other indicators show that the token is in overbought territory, a short-term pullback might occur before the bullish trend continues.
Conclusion: Is $IMT Set for a Bullish Run?
Based on recent price action, technical indicators, upcoming developments, and broader market sentiment, there are several signs suggesting that $IMT could be set for a bullish run. Key indicators like moving average crossovers, RSI strengthening, and breakouts above resistance are all pointing toward the potential for upward momentum. Additionally, if upcoming developments such as strategic partnerships, product launches, or positive market conditions continue to unfold, $IMT may experience sustained bullish price action.
However, traders and investors should remain vigilant, as the cryptocurrency market is inherently volatile. Monitoring technical levels, market sentiment, and news catalysts will be essential to gauging whether $IMT can maintain its bullish momentum or whether external factors could cause a shift in the trend.
$IMT
BTC-0.23%
FUEL-2.55%

Debby001#
2小時前
Navigating the $PARTI Tides: Understanding Price Fluctuations and Strategic Investment Windows
The $PARTI token, representing the Particle Network, operates within the volatile yet potentially lucrative cryptocurrency market. Recognizing the patterns of its price fluctuations and pinpointing strategic investment periods is crucial for any investor seeking to capitalize on its potential.
Understanding $PARTI's Price Volatility:
$PARTI, like all digital assets, experiences price swings driven by a complex interplay of factors:
* Market Sentiment and Hype:
* The cryptocurrency market is heavily influenced by online discourse, news cycles, and overall investor confidence. Positive buzz can trigger rapid price surges, while negative sentiment can lead to sharp declines.
* Technological Developments and Adoption:
* Particle Network's progress in developing and deploying its technology directly impacts $PARTI's value. Successful partnerships, platform updates, and increased user adoption can fuel price appreciation.
* Supply and Demand Dynamics:
* The circulating supply of $PARTI, its total supply, and the level of investor demand all contribute to price fluctuations. Understanding the token's distribution and potential scarcity is essential.
* Broader Cryptocurrency Market Trends:
* $PARTI's price is often correlated with the movements of major cryptocurrencies like Bitcoin and Ethereum. General market trends, regulatory changes, and macroeconomic factors can all influence its trajectory.
* Speculative Trading and Whale Activity:
* The crypto market attracts a significant amount of speculative trading, leading to rapid and unpredictable price movements. Large buy or sell orders from whales (large holders) can also create significant price swings.
* Project Related News:
* Any news relating to the Particle Network itself, such as partnership announcements, or technological breakthroughs, will greatly effect the $PARTI tokens price.
Identifying Strategic Investment Windows:
Pinpointing the optimal time to invest in $PARTI requires a thoughtful approach. While predicting the future with absolute certainty is impossible, here are some strategies:
* Dollar-Cost Averaging (DCA):
* This involves investing a fixed amount of capital at regular intervals, regardless of the price. DCA can mitigate the impact of volatility and reduce the risk of buying at a market peak.
* Dip Buying and Support Levels:
* Identifying periods of price corrections or dips, particularly when the price approaches established support levels, can present opportunities to buy $PARTI at a discount. However, confirm that the dip isn't a long-term downtrend.
* Trend Analysis and Breakout Points:
* Analyzing price charts and technical indicators can help identify potential trend reversals or breakout points. Investing during an established uptrend can increase the likelihood of profits.
* Fundamental Analysis and Project Milestones:
* Investing when the Particle Network achieves significant milestones, such as successful platform updates or strategic partnerships, can be a favorable strategy.
* Long-Term Vision and Hodling:
* If you have a strong belief in the long-term potential of the Particle Network, holding $PARTI for an extended period can potentially yield substantial returns, despite short-term volatility.
Key Considerations:
* The cryptocurrency market is inherently volatile, and any investment carries significant risk.
* Thorough research and risk management are paramount.
* It is very important to make sure to research the specific $PARTI token, as other tokens may share similar ticker symbols.
FUEL-2.55%
HYPE-2.81%

AshuBajwaB60
3小時前
# __The Future of Sustainable Transportation: The Rise of Electric Vehicles__
The transportation sector is one of the largest contributors to greenhouse gas emissions, accounting for nearly 30% of global emissions. However, a shift towards sustainable transportation is underway, driven by the increasing adoption of electric vehicles (EVs). In this article, we'll explore the future of sustainable transportation, the benefits of EVs, and the challenges that need to be addressed.
# Benefits of Electric Vehicles
EVs offer numerous benefits, including:
1. *Zero Emissions*: EVs produce zero tailpipe emissions, reducing greenhouse gas emissions and air pollution in urban areas.
2. *Lower Operating Costs*: EVs have lower operating costs compared to traditional gasoline-powered vehicles, with reduced fuel and maintenance costs.
3. *Improved Performance*: EVs offer improved performance, with faster acceleration and a smoother ride.
4. *Government Incentives*: Many governments offer incentives for EV adoption, including tax credits, rebates, and exemptions from certain fees.
# Challenges Facing Electric Vehicles
While EVs offer numerous benefits, there are still several challenges that need to be addressed, including:
1. *Charging Infrastructure*: The lack of charging infrastructure is a significant barrier to EV adoption, particularly in rural areas.
2. *Range Anxiety*: Range anxiety is a concern for many potential EV buyers, who worry about running out of charge before reaching their destination.
3. *High Upfront Costs*: EVs are often more expensive than traditional gasoline-powered vehicles, although their lower operating costs can make up for this over time.
4. *Battery Durability*: Concerns about battery durability and the impact of charging on battery life are also a challenge for EV adoption.
# The Future of Sustainable Transportation
The future of sustainable transportation is likely to be shaped by several factors, including:
1. *Technological Advancements*: Advances in technology, such as improved battery life and more efficient charging systems, will continue to drive the adoption of EVs.
2. *Government Policies*: Government policies, such as incentives for EV adoption and investments in charging infrastructure, will play a critical role in promoting sustainable transportation.
3. *Changing Consumer Behavior*: Changing consumer behavior, driven by increasing awareness of the environmental impacts of transportation, will also drive the adoption of sustainable transportation options.
4. *Investments in Alternative Fuels*: Investments in alternative fuels, such as hydrogen fuel cells and biofuels, will also play a role in shaping the future of sustainable transportation.
# Conclusion
The future of sustainable transportation is exciting, with the increasing adoption of EVs and investments in alternative fuels. However, there are still several challenges that need to be addressed, including the lack of charging infrastructure, range anxiety, and high upfront costs. As technology continues to evolve and government policies promote sustainable transportation, we can expect to see a significant shift towards sustainable transportation options.
# Recommendations
1. *Invest in Charging Infrastructure*: Invest in charging infrastructure, including public charging stations and home charging systems, to support the adoption of EVs.
2. *Promote Government Incentives*: Promote government incentives for EV adoption, including tax credits, rebates, and exemptions from certain fees.
3. *Educate Consumers*: Educate consumers about the benefits of EVs, including their environmental benefits, lower operating costs, and improved performance.
4. *Support Research and Development*: Support research and development in EV technology, including advances in battery life, charging systems, and alternative fuels.
5. *Encourage Sustainable Transportation Options*: Encourage sustainable transportation options, including public transportation, biking, and walking, to reduce our reliance on personal vehicles.
FUEL-2.55%
GAS-0.68%

Ade🌹
4小時前
Assessing the Current Market Sentiment for $BANANAS31: A Balanced Perspective
As of March 30, 2025, the market sentiment surrounding $BANANAS31, a meme coin on the BNB Chain, reflects a nuanced blend of cautious optimism and technical uncertainty. Priced around $0.0056 USD with a market cap of approximately $56M, the coin has seen a 24-hour trading volume of $5.1M-$5.23M, indicating sustained interest despite a recent dip from its all-time high of $0.0051. Posts on X reveal a community buoyed by its rapid growth—16,623 holders in weeks—but tempered by technical signals hinting at a potential shift.
Analysts on X note $BANANAS31 is consolidating, with support at $0.005-$0.0055 and resistance near $0.0065-$0.007. The RSI, hovering around 60, suggests mild bullishness but borders on overbought territory, while a flattening MACD indicates waning momentum. A descending triangle pattern and declining volume further fuel bearish concerns, with a possible breakdown below $0.00513 looming if support fails. Conversely, a breakout above $0.007 could reignite enthusiasm, targeting $0.01 in a speculative surge.
Social sentiment leans positive, with posts reflecting bullish chatter, yet this contrasts with technical caution, hinting at retail exuberance outpacing fundamentals. Lacking strong utility, $BANANAS31’s trajectory hinges on meme-driven hype and broader market trends. Investors appear split—some see a buying opportunity at support, others brace for a correction. For now, the sentiment is delicately poised, awaiting a decisive catalyst to tip the scales.
X+7.40%
FUEL-2.55%
相關資產


相近市值
在所有 Bitget 資產中,這8種資產的市值最接近 Fuel Network。