Bitget:全球日交易量排名前 4!
BTC 市占率62.05%
BTC/USDT$83103.20 (-0.42%)恐懼與貪婪指數34(恐懼)
山寨季指數:0(比特幣季)
盤前交易幣種PAWS,WCT比特幣現貨 ETF 總淨流量:-$64.9M(1 天);-$169.2M(7 天)。Bitget 新用戶立享 6,200 USDT 歡迎禮包!立即領取
到 Bitget App 隨時隨地輕鬆交易!立即下載
Bitget:全球日交易量排名前 4!
BTC 市占率62.05%
BTC/USDT$83103.20 (-0.42%)恐懼與貪婪指數34(恐懼)
山寨季指數:0(比特幣季)
盤前交易幣種PAWS,WCT比特幣現貨 ETF 總淨流量:-$64.9M(1 天);-$169.2M(7 天)。Bitget 新用戶立享 6,200 USDT 歡迎禮包!立即領取
到 Bitget App 隨時隨地輕鬆交易!立即下載
Bitget:全球日交易量排名前 4!
BTC 市占率62.05%
BTC/USDT$83103.20 (-0.42%)恐懼與貪婪指數34(恐懼)
山寨季指數:0(比特幣季)
盤前交易幣種PAWS,WCT比特幣現貨 ETF 總淨流量:-$64.9M(1 天);-$169.2M(7 天)。Bitget 新用戶立享 6,200 USDT 歡迎禮包!立即領取
到 Bitget App 隨時隨地輕鬆交易!立即下載


Red The Mal 價格RED
未上架
報價幣種:
TWD
數據來源於第三方提供商。本頁面和提供的資訊不為任何特定的加密貨幣提供背書。想要交易已上架幣種? 點擊此處
NT$0.02164-4.85%1D
價格走勢圖
最近更新時間 2025-04-06 07:43:08(UTC+0)
市值:--
完全稀釋市值:--
24 小時交易額:--
24 小時交易額/市值:0.00%
24 小時最高價:NT$0.02354
24 小時最低價:NT$0.02239
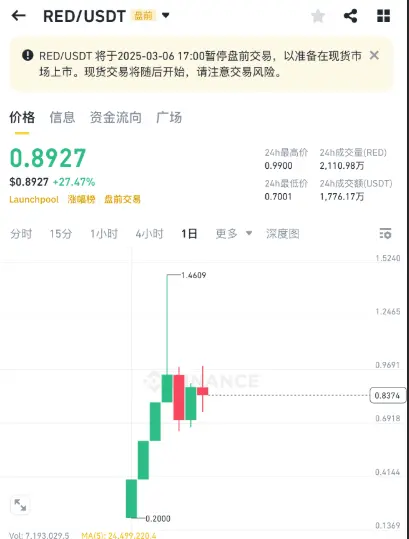
歷史最高價:NT$2.18
歷史最低價:NT$0.0007800
流通量:-- RED
總發行量:
99,680,315.47RED
流通率:0.00%
最大發行量:
--RED
以 BTC 計價:0.{8}7858 BTC
以 ETH 計價:0.{6}3628 ETH
以 BTC 市值計價:
--
以 ETH 市值計價:
--
合約:
7zfnQC...wd7wtY3(Solana)
更多
您今天對 Red The Mal 感覺如何?
注意:此資訊僅供參考。
Red The Mal 今日價格
Red The Mal 的即時價格是今天每 (RED / TWD) NT$0.02164,目前市值為 NT$0.00 TWD。24 小時交易量為 NT$0.00 TWD。RED 至 TWD 的價格為即時更新。Red The Mal 在過去 24 小時內的變化為 -4.85%。其流通供應量為 0 。
RED 的最高價格是多少?
RED 的歷史最高價(ATH)為 NT$2.18,於 2024-03-19 錄得。
RED 的最低價格是多少?
RED 的歷史最低價(ATL)為 NT$0.0007800,於 2024-01-09 錄得。
Red The Mal 價格預測
RED 在 2026 的價格是多少?
根據 RED 的歷史價格表現預測模型,預計 RED 的價格將在 2026 達到 NT$0.02393。
RED 在 2031 的價格是多少?
2031,RED 的價格預計將上漲 -4.00%。 到 2031 底,預計 RED 的價格將達到 NT$0.05517,累計投資報酬率為 +162.32%。
Red The Mal 價格歷史(TWD)
過去一年,Red The Mal 價格上漲了 -97.38%。在此期間, 兌 TWD 的最高價格為 NT$1.52, 兌 TWD 的最低價格為 NT$0.02239。
時間漲跌幅(%) 最低價
最低價 最高價
最高價 
 最低價
最低價 最高價
最高價 
24h-4.85%NT$0.02239NT$0.02354
7d-11.49%NT$0.02239NT$0.02704
30d-27.80%NT$0.02239NT$0.05429
90d-48.70%NT$0.02239NT$0.05471
1y-97.38%NT$0.02239NT$1.52
全部時間-97.65%NT$0.0007800(2024-01-09, 1 年前 )NT$2.18(2024-03-19, 1 年前 )
Red The Mal 市場資訊
Red The Mal 持幣分布集中度
巨鯨
投資者
散戶
Red The Mal 地址持有時長分布
長期持幣者
游資
交易者
coinInfo.name(12)即時價格表

Red The Mal 評級
社群的平均評分
4.4
此內容僅供參考。
RED 兌換當地法幣匯率表
1 RED 兌換 MXN$0.011 RED 兌換 GTQQ0.011 RED 兌換 CLP$0.631 RED 兌換 UGXSh2.381 RED 兌換 HNLL0.021 RED 兌換 ZARR0.011 RED 兌換 TNDد.ت01 RED 兌換 IQDع.د0.851 RED 兌換 TWDNT$0.021 RED 兌換 RSDдин.0.071 RED 兌換 DOP$0.041 RED 兌換 MYRRM01 RED 兌換 GEL₾01 RED 兌換 UYU$0.031 RED 兌換 MADد.م.0.011 RED 兌換 AZN₼01 RED 兌換 OMRر.ع.01 RED 兌換 SEKkr0.011 RED 兌換 KESSh0.081 RED 兌換 UAH₴0.03
- 1
- 2
- 3
- 4
- 5
最近更新時間 2025-04-06 07:43:08(UTC+0)
Red The Mal 動態

RedStone澄清:未與Web3Port和Whisper合作
Bitget•2025-03-20 05:54

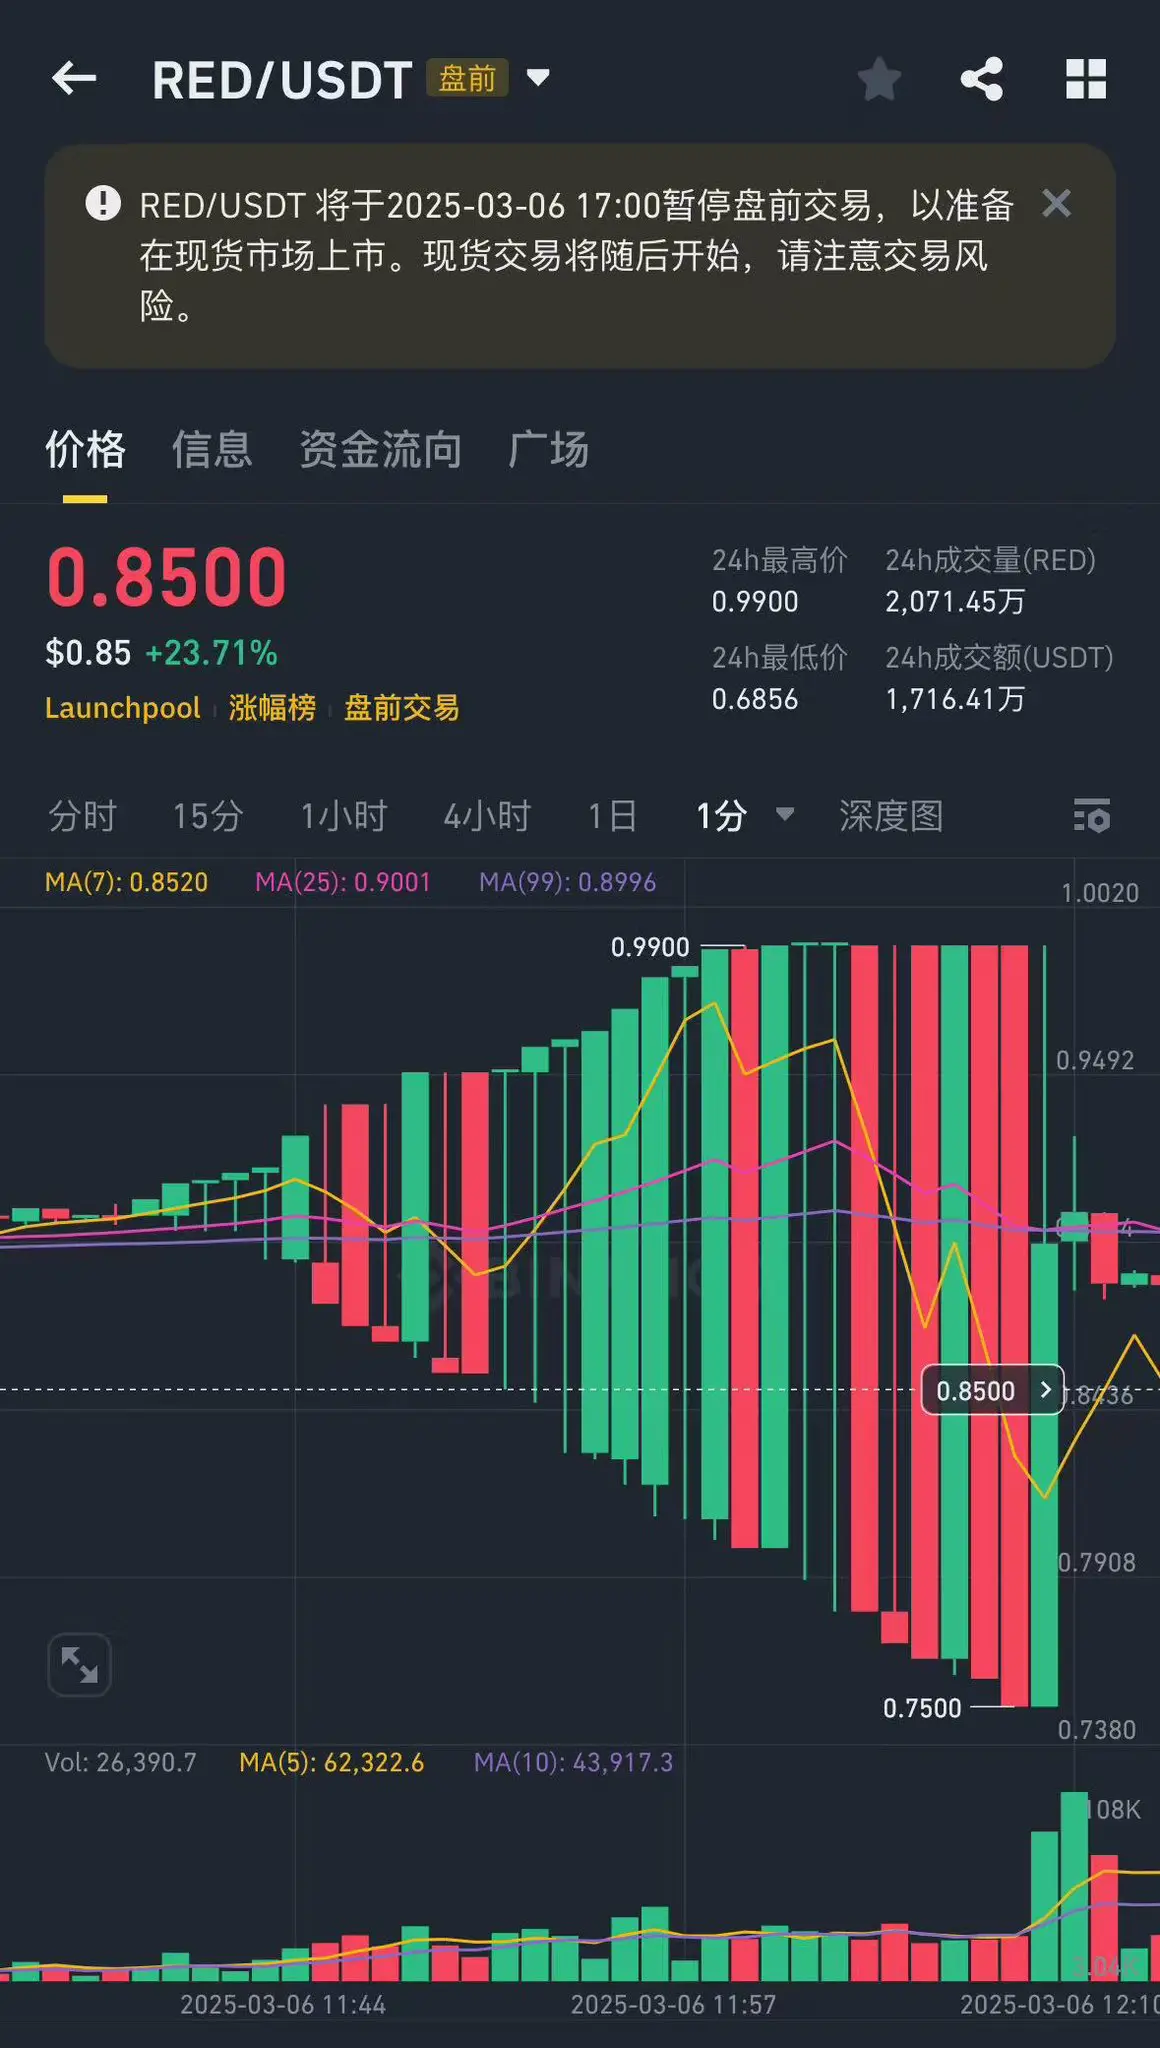
RED短暫突破0.85美元
Bitget•2025-03-15 19:38

Bitget x RED 嘉年華:瓜分 79,500 RED
Bitget Announcement•2025-03-07 05:00


購買其他幣種
用戶還在查詢 Red The Mal 的價格。
Red The Mal 的目前價格是多少?
Red The Mal 的即時價格為 NT$0.02(RED/TWD),目前市值為 NT$0 TWD。由於加密貨幣市場全天候不間斷交易,Red The Mal 的價格經常波動。您可以在 Bitget 上查看 Red The Mal 的市場價格及其歷史數據。
Red The Mal 的 24 小時交易量是多少?
在最近 24 小時內,Red The Mal 的交易量為 NT$0.00。
Red The Mal 的歷史最高價是多少?
Red The Mal 的歷史最高價是 NT$2.18。這個歷史最高價是 Red The Mal 自推出以來的最高價。
我可以在 Bitget 上購買 Red The Mal 嗎?
可以,Red The Mal 目前在 Bitget 的中心化交易平台上可用。如需更詳細的說明,請查看我們很有幫助的 如何購買 指南。
我可以透過投資 Red The Mal 獲得穩定的收入嗎?
當然,Bitget 推出了一個 策略交易平台,其提供智能交易策略,可以自動執行您的交易,幫您賺取收益。
我在哪裡能以最低的費用購買 Red The Mal?
Bitget提供行業領先的交易費用和市場深度,以確保交易者能够從投資中獲利。 您可通過 Bitget 交易所交易。
在哪裡可以購買加密貨幣?
影片部分 - 快速認證、快速交易

如何在 Bitget 完成身分認證以防範詐騙
1. 登入您的 Bitget 帳戶。
2. 如果您是 Bitget 的新用戶,請觀看我們的教學,以了解如何建立帳戶。
3. 將滑鼠移到您的個人頭像上,點擊「未認證」,然後點擊「認證」。
4. 選擇您簽發的國家或地區和證件類型,然後根據指示進行操作。
5. 根據您的偏好,選擇「手機認證」或「電腦認證」。
6. 填寫您的詳細資訊,提交身分證影本,並拍攝一張自拍照。
7. 提交申請後,身分認證就完成了!
加密貨幣投資(包括透過 Bitget 線上購買 Red The Mal)具有市場風險。Bitget 為您提供購買 Red The Mal 的簡便方式,並且盡最大努力讓用戶充分了解我們在交易所提供的每種加密貨幣。但是,我們不對您購買 Red The Mal 可能產生的結果負責。此頁面和其包含的任何資訊均不代表對任何特定加密貨幣的背書認可,任何價格數據均採集自公開互聯網,不被視為來自Bitget的買賣要約。
Bitget 觀點

E_Perry
6小時前
$XRP is in a tough place as it enters a difficult market environment. At the time of writing, XRP price is at $2.23, indicating a 5.83% decline for the past 24 hours.
This decline can be related to the overall market correction, but price action and technical indicators are showing something deeper in the price movement.
XRP Price Analysis
XRP describes choppy-event price action between November 2024 and April 2025. Starting at $0.5040, XRP’s price went all the way up to $2.4660 by early January 2025 for a 389% compound gain.$
Prior to trading at $2.1464, XRP’s price dropped to an intraday loss of -4.18% on March 28th, 2025. XRP is testing a descending triangle with minor resistance at $2.24161 and minor support down at $1.93870.
If the price breaks below this minor support level, XRP can head down to target $1.50404. Conversely, an organized effort by bulls will begin if it breaks above $2.4660.
Technical Indicators Signal XRP’s Future
At a value of 49.54, the Relative Strength Index (RSI) is nearing oversold territory, potentially triggering buying interest if it crosses below 40. The Moving Average Convergence Divergence (MACD) has a bearish outlook, as MACD is at -0.0179 while the signal line is at -0.016.
Since the MACD line crossed the signal line, bears are still pressing this chart for further downside, likely forcing the price of XRP to $1.93870 in the near term. However, the narrowing histogram does hint at the possibility of a trend reversal if bulls step in.
This means that if the price breaks above $2.2215, crypto bulls could help push it to $2.4660. However, without significant support for the XRP price, it could try to retest lower levels toward $1.50404.
Liquidation Heatmap: A Contest Between Bulls and Bears
The liquidation heatmap has experienced extreme activity characterized by failed short liquidations (red) recently dominating price action concerning short liquidation, particularly around the $2.1464 range. There are a few long liquidations (green), indicating that bears are still in charge.
If a massive price were to suddenly spike to the upside, there could potentially be a short squeeze, sending the price to $2.31682. Otherwise, if slight selling pressure continues, the price will go lower, testing support at $1.93870.
Conclusion: What Lies Ahead for XRP?
The circumstances surrounding XRP remain grim on the short-term outlook. Overall sentiment, liquidation data, and technical indicators present reasons for cautiousness. The key support level remains $1.93870, and if this level is lost, there could be further downside.
However, if XRP can get back above $2.24161, it might spark some bullish momentum. XRP remains precariously on the tipping point. Watching for a decisive breach above $2.4660 would indicate bullish characteristics, while a failure of support could lead the price down to $1.50404.
RED-4.92%
XRP-2.37%
BGUSER-JLSA0FAF
6小時前
Ripple’s XRP cryptocurrency has faced immense selling
Ripple’s XRP cryptocurrency has faced immense selling pressure over the past month, with its price falling 13% in the last 30 days. The asset’s dropoff slowed last week, but some analysts are still fearful of a further slump. President Donald Trump’s sweeping global tariff announcement caused concerns in both the stock and crypto markets. Thus, top tokens like XRP, ETH, and even SOL are facing pressure.The introduction of tariffs triggered $19 million in liquidations over the last day. Moreover, XRP is now facing the critical $2 support. Indeed, the token fell to the $1.9 level Thursday but has rebounded upwards over the last 48 hours, according to CoinMarketCap. Experts have identified a descending triangle on the asset’s daily chart. Subsequently, the crypto’s price could drop even further with a continuing sell-off. Ultimately, it could settle at $0.62 lows if it fails to stay above the $2 mark.Furthermore, popular crypto analyst, Ali Martinez, recently posted on X about a major technical red flag emerging in Ripple XRP’s price. The coin recently broke below the $2 neckline of a head-and-shoulders pattern, a bearish formation commonly associated with trend reversals and steep corrections. $XRP
RED-4.92%
X-2.06%
BGUSER-JLSA0FAF
6小時前
breakdown from the rising channel, BTC
breakdown from the rising channel, BTC is now consolidating in a falling wedge. We’re currently at a critical level, testing both trendline resistance and mid-range structure. Two scenarios to watch: Bearish Case (Image 1): If BTC gets rejected again from the red trendline, we could see a breakdown targeting the $75K–$73.6K zone. This would complete the larger distribution phase. Bullish Case (Image 2): A clean breakout above the red trendline + $84K zone would shift momentum bullish, opening doors to $90K+ and possibly $99.5K in the coming weeks. Key Levels: Support: $78.2K | $75K Resistance: $84K | $90.9K | $99.5K $BTC is approaching a decision point. Prepare for volatility. Let the price action guide you not emotions. #BTC #crypto #BitcoinAnalysis #altcoinseason$BTC
RED-4.92%
BTC-0.50%

CryptoStrategyBasic
8小時前
$PI
PI/USDT Post-Market Strategy – Heikin Ashi Confirmation & Tactical Setup
After a volatile trading session, PI/USDT appears to be stabilizing with hints of a trend shift. The Heikin Ashi chart above confirms some key signals you can use to shape your strategy moving forward.
Heikin Ashi Insights:
1. Trend Momentum Shifting:
The last two candles turned green after a series of strong red ones, indicating a potential end to the short-term downtrend.
2. Wick Patterns Matter:
The earlier red candles have long lower wicks—often a sign of price rejection to the downside, which signals growing buyer strength.
3. Candle Body Dynamics:
The last green candle shows a larger body and short lower wick—supporting continued upward movement if volume sustains.
Market Strategy Plan:
1. Short-Term Strategy (Intraday to 1D)
Buy Zone: $0.58–$0.61 (as long as price holds above $0.58, bulls have room to play).
Sell/TP Levels: $0.70, $0.78, and $0.85 for staged exits.
Stop-Loss: Below $0.56 to minimize risk in case of reversal.
2. Mid-Term Swing Setup (1W Outlook)
Watch for consolidation above $0.65 with volume.
A confirmed breakout above $0.78 could launch a rally back toward the $1.00 psychological level.
Consider dollar-cost averaging between $0.58–$0.65 with a 2-week outlook.
3. Caution for Shorts:
Avoid aggressive shorting unless the price breaks down below $0.56 with strong volume and wide-body red Heikin Ashi candles.
Conclusion: Heikin Ashi candles are smoothing out volatility and signaling a brewing trend shift. Traders should watch the $0.65–$0.70 zone closely—it’s the battlefield between bulls and bears. Break above? Bulls charge. Fall below $0.56? Bears regain control.
Always manage your position size, trade the trend, and adapt as data evolves.
RED-4.92%
PI+4.90%

Wavvylad
8小時前
PUMP Shows Bearish Pressure Despite Short-Term Support at $0.042
The PUMP/USDT pair is currently trading at $0.04286, reflecting a -2.35% drop over the past 24 hours. The hourly chart show that $PUMP is struggling to maintain upward momentum, as seen by its rejection near the $0.04505 resistance and a local low of $0.04134. Notably, the token has been trading in a tight range, hovering just above the $0.042 level, a key area aligning with the short-term moving averages.
The convergence of the MA(5), MA(10), and MA(20) at $0.04260, $0.04259, and $0.04242 respectively suggests a period of consolidation. These moving averages are flatlining, indicating indecision in the market, although the recent red candles and decreasing volume hint at a possible bearish continuation if support at $0.042 breaks. A dip below the $0.041 mark could push the price to test the recent low of $0.04011 or even extend toward $0.0399.
Volume analysis shows weakening interest, with trading volume dropping from previous spikes to about 78.78K further confirming fading momentum. The chart also displays a recent "B" (buy) signal, possibly triggered by a slight price bounce, but without volume support, this recovery may be short-lived.
For traders, the immediate focus should be on whether$PUMP can hold above its average buy price and short-term MAs. A breakout above $0.045 with strong volume could revive bullish sentiment, while a breakdown below $0.041 would likely trigger sell-offs. Risk management is key in this indecisive zone.
RED-4.92%
HOLD+1.29%
相關資產
最近新增
最近新增的加密貨幣
相近市值
在所有 Bitget 資產中,這8種資產的市值最接近 Red The Mal。


