Solana Price Prediction: Is SOL Ready for a Reversal or More Downside Ahead?

Solana (SOL) has been one of the most resilient altcoins in the crypto market, delivering impressive gains during bullish cycles. However, after reaching a peak above $280, SOL has faced significant selling pressure, leading to a steady decline in price. Now trading around $143, traders and investors are questioning whether this marks the end of the downtrend or if further declines are still possible.
With Solana price testing key support levels, technical indicators are flashing mixed signals. The Relative Strength Index (RSI) is deeply oversold, suggesting that a potential bounce could be on the horizon. However, the overall bearish structure remains intact, keeping downside risks alive. The big question now is: Is Solana price gearing up for a major reversal, or will it see further downside before a true recovery? Let's analyze the chart to uncover potential price movements in the coming weeks.
Solana Price Prediction: Is Solana Finding a Bottom After Its Recent Decline?
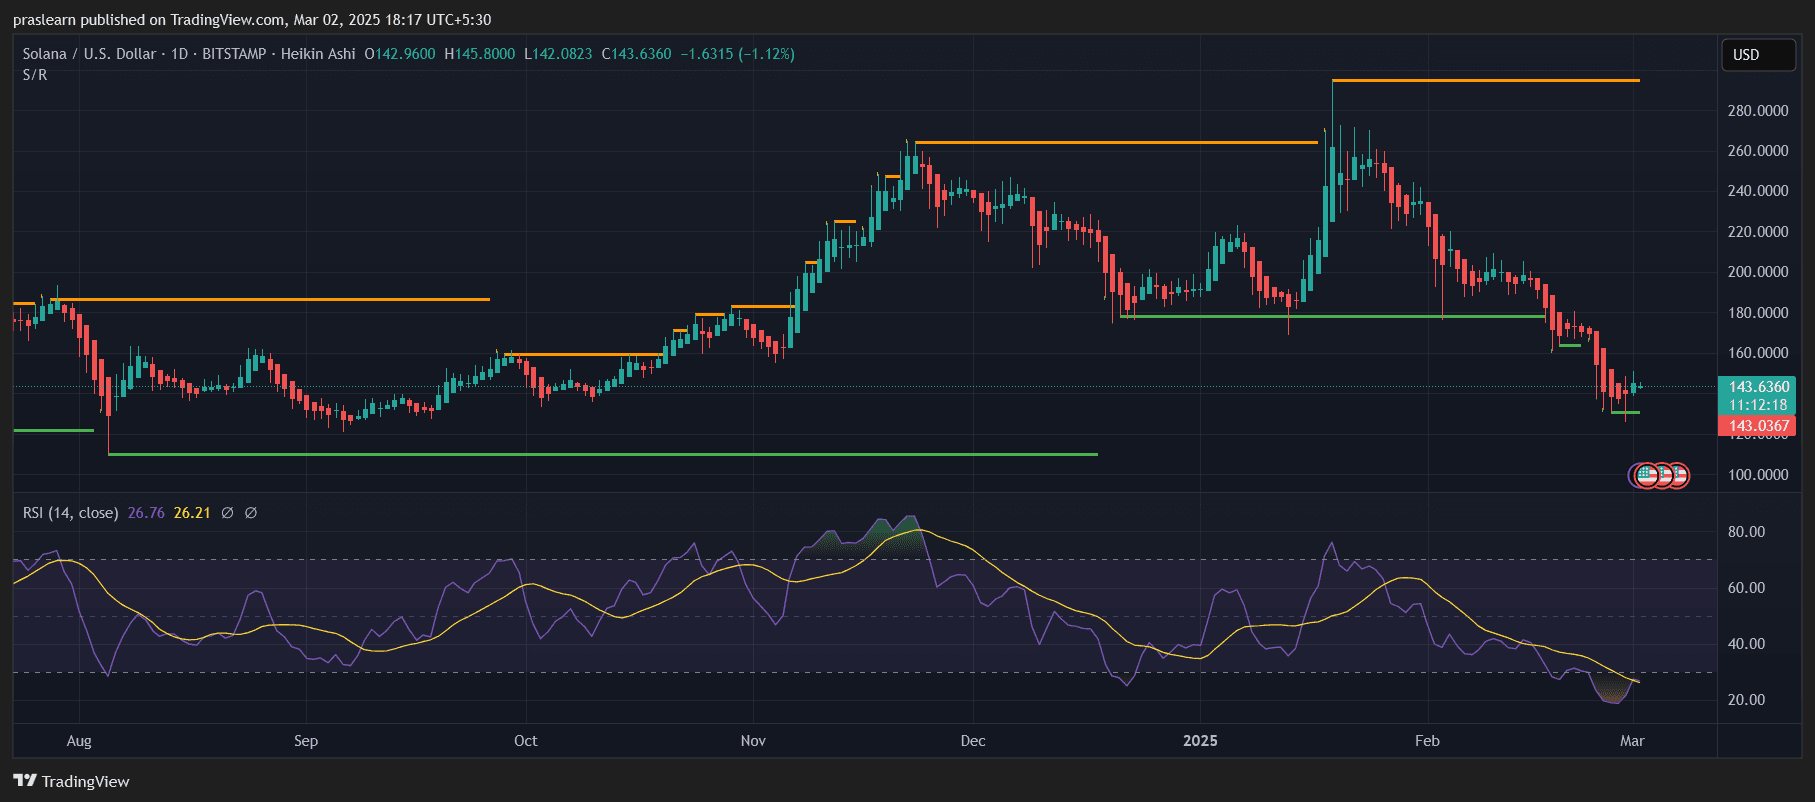 SOL/USD Daily Chart- TradingView
Solana (SOL) has been in a clear downtrend since peaking above $280 earlier this year. The latest price action shows that SOL has bounced off a strong support level near $140, which has acted as a historical demand zone in the past. However, despite this temporary relief, Solana remains in a bearish structure, as evidenced by a series of lower highs and lower lows.
The green support lines on the chart highlight previous demand zones, with the most recent bounce occurring after a sharp decline from the $180-$190 range. The question now is whether SOL has found a solid bottom or if another wave of selling pressure could push prices lower.
What Do the Indicators Suggest?
The Relative Strength Index (RSI) is currently sitting around 26.76, which is deep in the oversold territory. Historically, an RSI below 30 suggests that a potential relief rally or reversal could be in play. However, an oversold RSI alone is not enough to confirm a trend reversal—it only indicates that the selling pressure may be temporarily exhausted.
Another crucial observation is the RSI’s failure to show a bullish divergence. This suggests that while SOL price is oversold , there isn’t yet a clear indication that momentum is shifting in favor of the bulls. The moving average on the RSI remains in a downward slope, meaning that further consolidation or downside movement is still on the table.
Can SOL Price Break Above Key Resistance Levels?
For a bullish recovery, SOL price needs to break through key resistance levels. The first resistance is around $160-$165, which aligns with previous support turned resistance. If SOL can push above this range with strong volume, it could signal the beginning of a recovery.
The next major resistance level is seen near $190-$200, a region that acted as a critical supply zone during the previous rally. If Solana fails to reclaim these levels, any short-term rally could be a mere relief bounce before another downturn.
Will Solana Price Drop Below $140 If Weakness Continues?
On the downside, the $140 support level is the most critical area to watch. A daily close below $140 could open the door for further declines toward $120 or even $100, as seen from previous market structures.
Given the ongoing bearish momentum, a lower high formation followed by rejection at resistance could signal another leg down. If the broader crypto market, particularly Bitcoin, shows further weakness, Solana could struggle to hold above this key psychological level.
Solana Price Prediction: What’s Next?
The current price action suggests that SOL is at a critical juncture . While oversold conditions may trigger a short-term bounce, the overall structure remains bearish unless key resistance levels are reclaimed. Traders should watch for confirmation signals, such as increasing buying volume, RSI divergence, or a successful retest of support to gauge whether a sustainable reversal is in play.
For now, caution is advised, as a failure to reclaim resistance levels could result in another wave of selling pressure, potentially sending SOL to retest lower support zones in the coming weeks.
Disclaimer: The content of this article solely reflects the author's opinion and does not represent the platform in any capacity. This article is not intended to serve as a reference for making investment decisions.
You may also like
Former Football Star Ronaldinho's Token Issued Suspiciously! Blockchain Firm Explains!
Blockchain security firm GoPlus has warned investors about the STAR10 token launched by former football star Ronaldinho.
Japanese Investment Firm Metaplanet Continues to Buy Bitcoin! Here is the Latest BTC Purchase Amount
Metaplanet purchased $13.4 million worth of BTC as part of its long-term bullish outlook on the cryptocurrency.
Is It the Ideal Time to Buy Bitcoin (BTC) and Altcoins? This Indicator Has Given a Signal!
CryptoQuant analyst shares his simple yet historically profitable Bitcoin buying strategy.
Crypto Analyst: Stablecoin Circulation Key Metric for Blockchain Legitimacy