APT and ATOM Hold Key Support After Major Decline – Can This Pattern Spark a Recovery?

Date: Fri, March 14, 2025 | 11:10 AM GMT
The cryptocurrency market is showing signs of stabilization after experiencing a significant downtrend following the late 2024 rallies. Among the hardest-hit altcoins , Aptos (APT) and Cosmos (ATOM) have suffered sharp corrections—APT plunging 62% and ATOM dropping 55% over the last 90 days, shaking investor confidence.
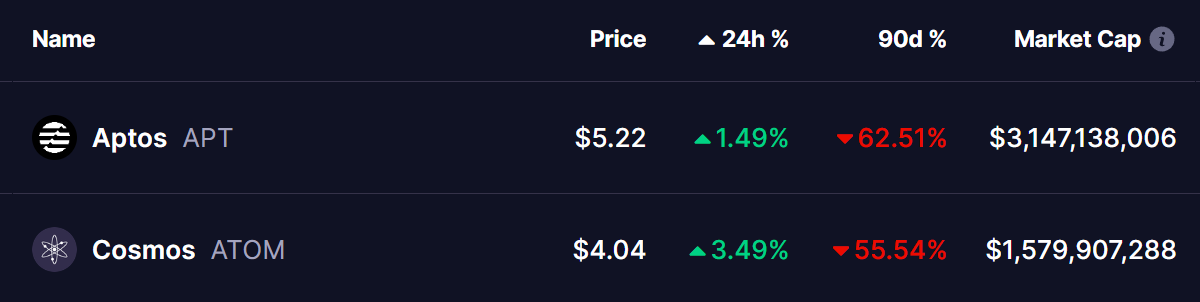 Source: Coinmarketcap
However, both assets are now holding at key support levels and forming a double bottom pattern, a historically bullish reversal structure that could set the stage for recovery.
Aptos (APT) Analysis
APT’s weekly chart signals the formation of a double bottom pattern, which emerged after the price failed to sustain above the $12.06 resistance in early December 2024. That rejection led to a sharp downturn, pushing APT back down to $5.0, marking the second bottom of the pattern.
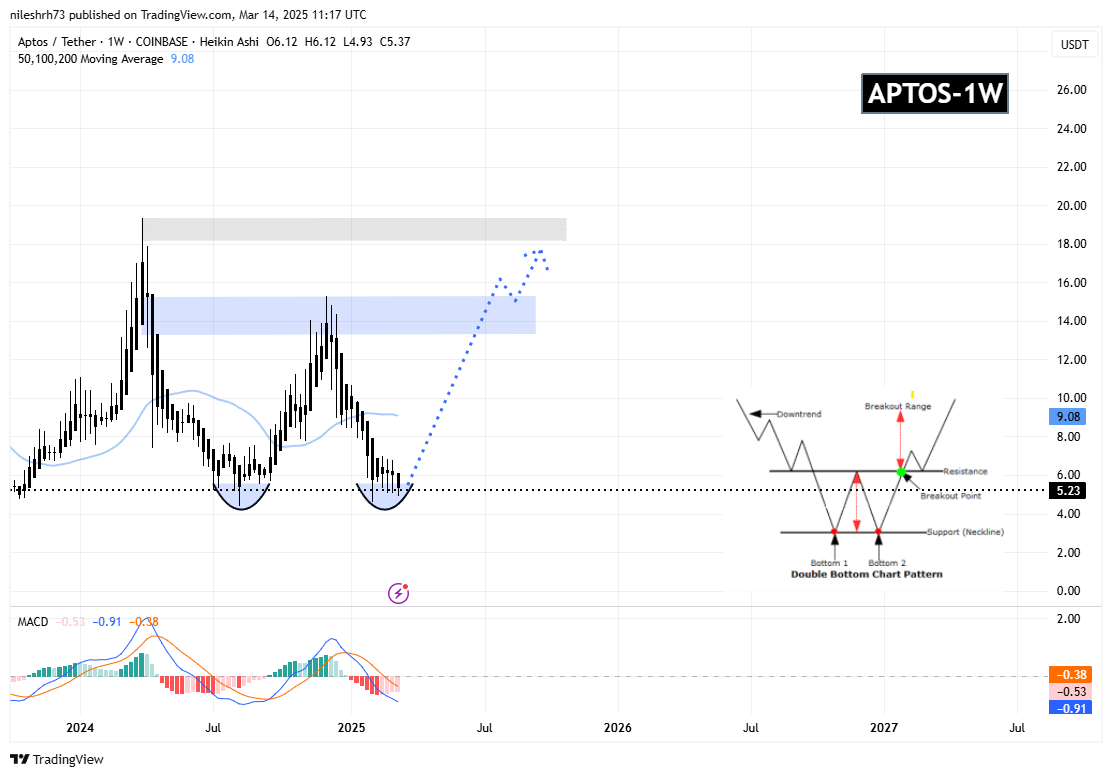 Aptos (APT) Weekly Chart/Coinsprobe (Source: Tradingview)
Encouragingly, buyers have defended this level, leading to a small rebound, with APT currently trading around $5.23. This suggests that demand is returning at this critical support zone.
Adding to this bullish outlook, the MACD (Moving Average Convergence Divergence) indicator is showing early signs of a bullish crossover, which historically signals a shift in momentum in favor of buyers.
If this pattern plays out, APT could retest the $12.06 neckline resistance in the coming weeks. A decisive breakout above this level could confirm the trend reversal, potentially sparking a strong rally toward the $20+ range in the coming months.
Cosmos (ATOM) Analysis
ATOM is following a similar trajectory to APT, forming a double bottom pattern after failing to break the $10.67 resistance in early December 2024. Since then, ATOM has revisited the $3.75 support, marking the second bottom of the pattern.
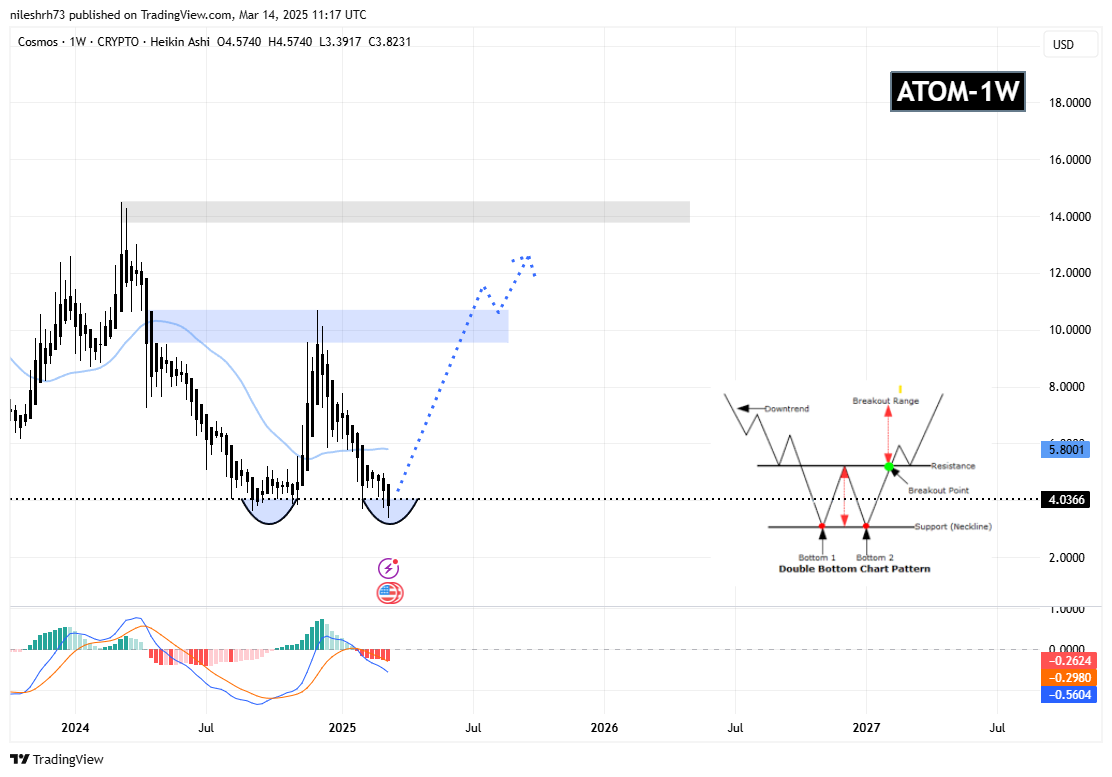 Cosmos (ATOM) Weekly Chart/Coinsprobe (Source: Tradingview)
Like APT, buyers have stepped in to defend this level, resulting in a modest bounce to $4.03, suggesting that the selling pressure may be fading.
The MACD indicator for ATOM is also hinting at a potential bullish crossover. If this pattern continues to play out, ATOM could make another attempt to reclaim the $10.67 neckline resistance in the near term.
A confirmed breakout above this level could trigger a bullish rally toward the $14+ range, offering significant upside potential.
Will This Pattern Spark a Reversal?
Right now, both APT and ATOM are at a critical juncture. Their double bottom formations indicate that as long as they hold their key support levels, there is a strong chance for a bounce. However, a bullish confirmation will only occur if these assets break above their key moving averages (MAs)—indicating a shift in momentum.
Another crucial factor influencing their recovery is Ethereum’s price action. If ETH begins a strong uptrend, it could trigger a broader altcoin rally, reinforcing APT and ATOM’s bullish outlook.
Disclaimer: This article is for informational purposes only and should not be considered financial advice. Always conduct your own research before making any investment decisions.
Disclaimer: The content of this article solely reflects the author's opinion and does not represent the platform in any capacity. This article is not intended to serve as a reference for making investment decisions.
You may also like
Californian Man Sentenced to Prison For 7 years for Crypto Laundering
Hyperliquid Hits $1 Trillion in Trading Volume, Rivals CEX
Ethereum Forms Potential Bottom as Price Holds Above $1,900 Support

Solana Confirms Hidden Bull Divergence: Is a 107% Surge Now in Play?