EOS Price Breakout: Is This the Start of a Major Bull Run?

EOS , a long-time favorite among altcoin enthusiasts, has shown a sudden surge in both price and momentum. After weeks of consolidation, the EOS price is now making headlines with bullish patterns forming across both short-term (hourly) and long-term (daily) charts. This analysis decodes whether the recent move is a fakeout or the beginning of a strong rally.
EOS Price Prediction: Is the Hourly Chart Flashing a Short-Term Reversal?
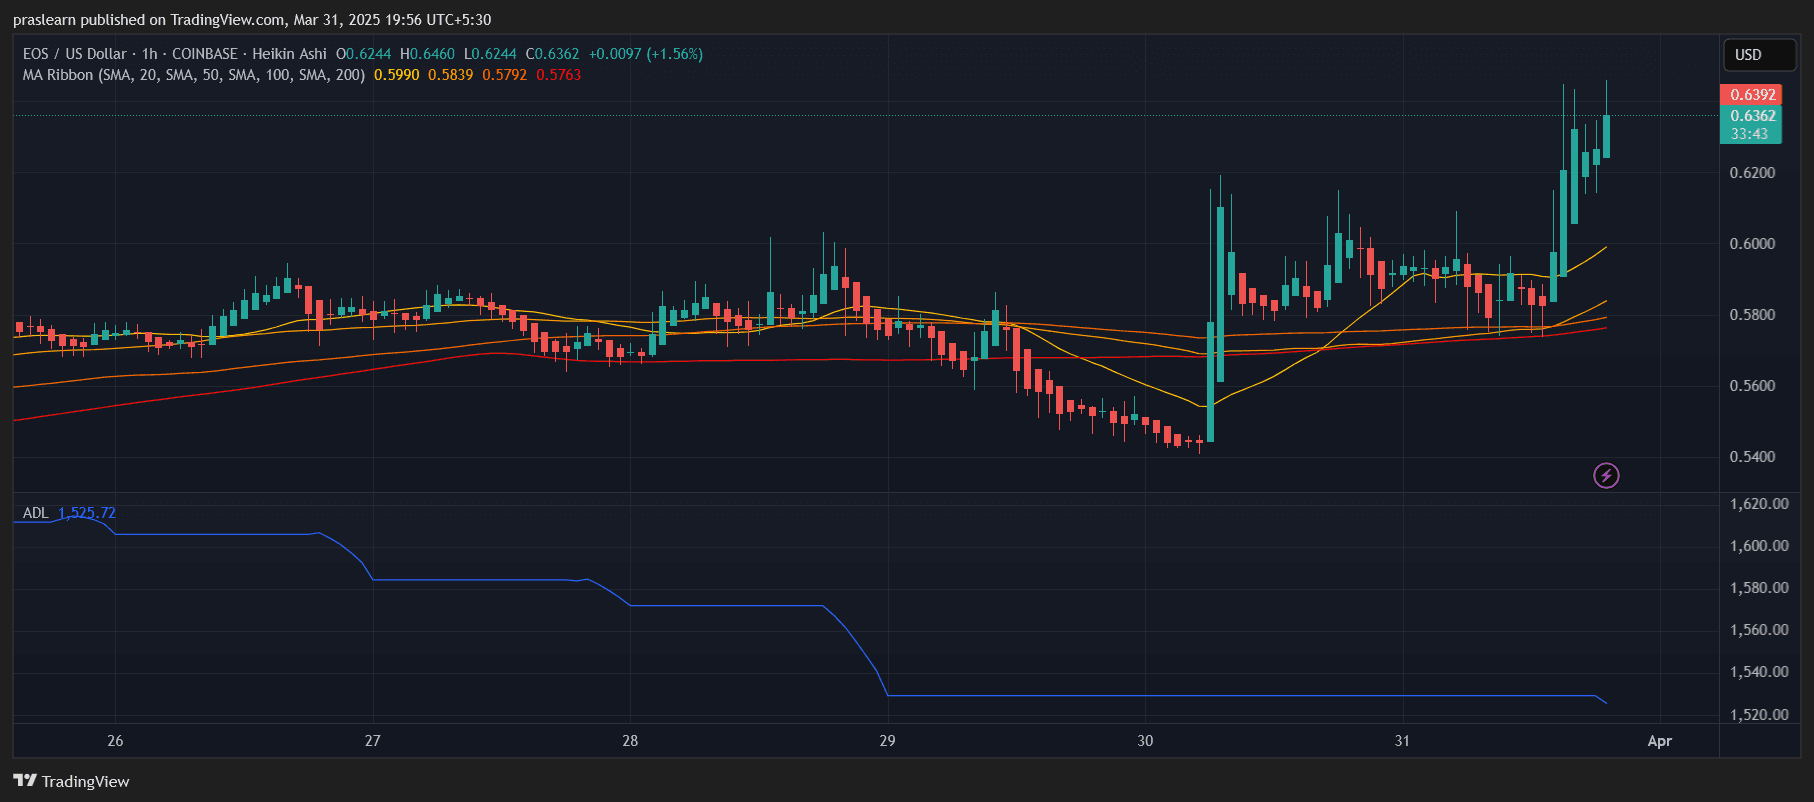 EOS/USD 1 Hr Chart- TradingView
The EOS/USD hourly chart presents a textbook bullish breakout. Starting with the Heikin Ashi candles, we see a clear shift from indecisive red-blue sequences to solid green candles with minimal lower wicks — an indication of strong intraday bullish momentum.
The Moving Average (MA) Ribbon, which consists of the 20, 50, 100, and 200-period simple moving averages (SMA), shows a classic bullish crossover setup:
- The 20 SMA ($0.599) has cleanly crossed above the 50, 100, and 200 SMAs, signaling upward pressure.
- Price action has now broken well above the entire MA ribbon, currently trading at $0.6362, suggesting that buyers have regained full control.
Another critical observation is the Accumulation/Distribution Line (ADL), which continues its downward slope, a divergence from price. While this might raise eyebrows, it often represents late accumulation where price moves first before on-chain volume catches up. If ADL flattens or ticks upward in the next few sessions, it could confirm strong underlying buying.
This chart signals a strong near-term bullish reversal, potentially heading toward testing resistance levels near $0.66 to $0.70.
---> Click here to Trade EOS with Bitget <---
Does the Daily Chart Confirm a Macro Trend Reversal?
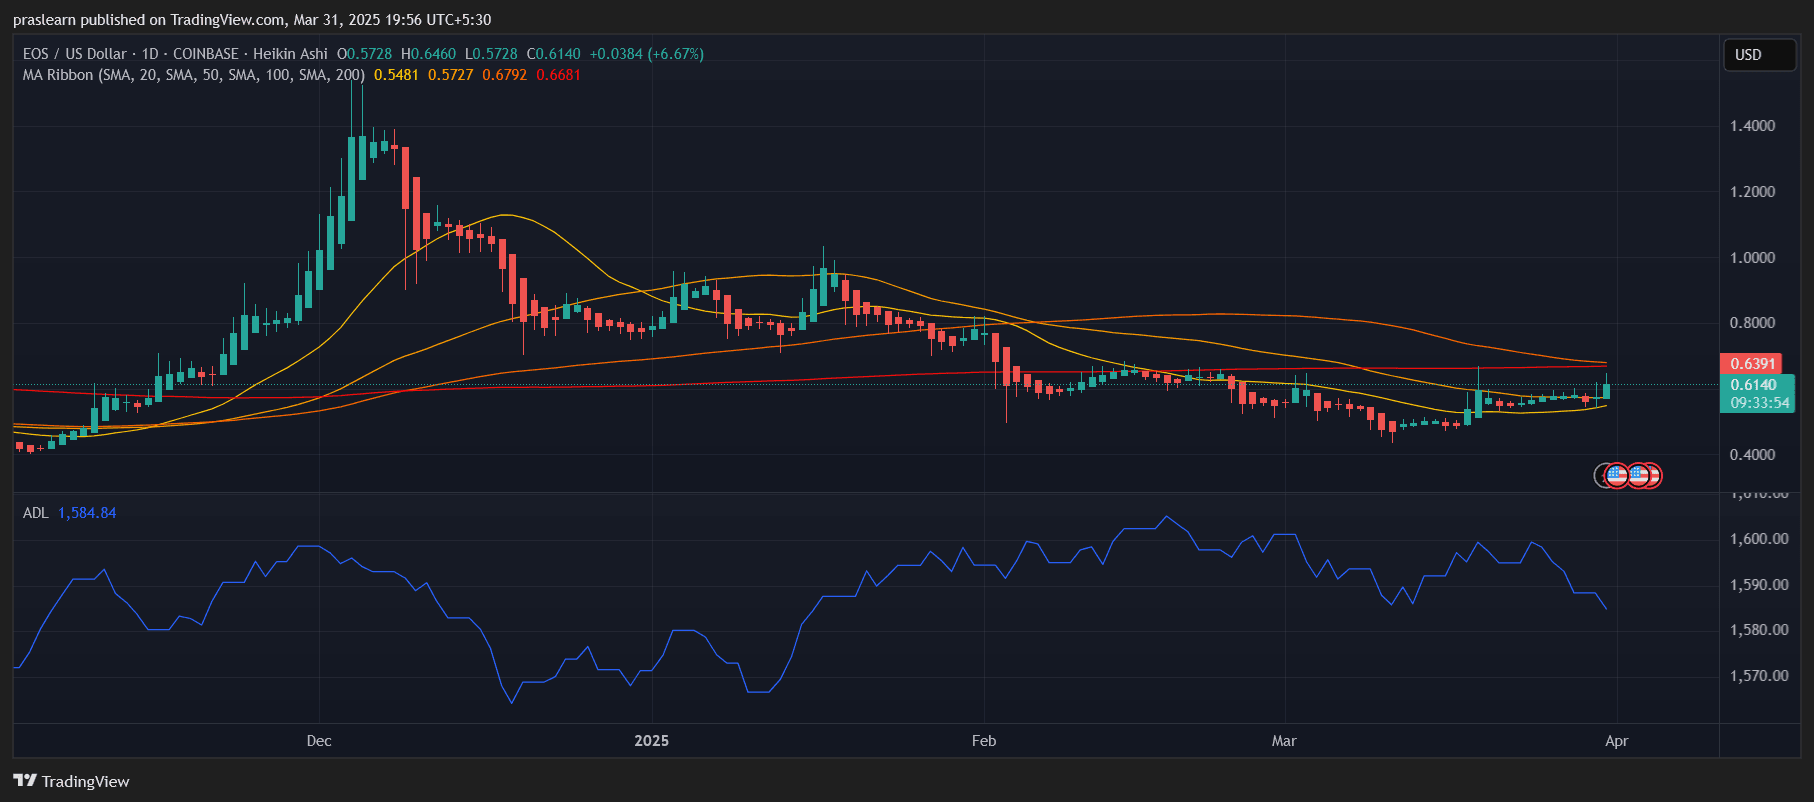 EOS/USD Daily Chart- TradingView
On the daily EOS/USD chart , a deeper narrative unfolds. EOS price had been in a downtrend since the December 2024 high around $1.40, but that bearish momentum has weakened over March 2025.
Now, things are shifting:
- EOS closed today up 6.67%, touching a high of $0.646, and is currently trading at $0.614 — decisively above the 20-day SMA ($0.5481) and inching above the 50-day SMA ($0.5727).
- This is significant because it’s the first break above the 50 SMA in over two months, hinting at a mid-term trend change.
However, two upper resistance layers remain — the 100 SMA ($0.6792) and 200 SMA ($0.6681). The area between $0.66 and $0.68 will be a strong supply zone. A breakout above that zone with volume would likely push EOS into price discovery toward $0.80 and beyond.
Interestingly, the ADL (Accumulation/Distribution Line) on the daily chart is also showing a slight downtrend, though much less steep than on the hourly chart. This indicates that broader sentiment may still be cautious — a classic setup for a surprise breakout if volume floods in.
What Are the Key Indicators Saying?
Let’s break down the most relevant indicators used across both charts:
- Heikin Ashi Candles: Smooth out price noise, showing momentum shifts. Both charts now display strong green candles with minimal wicks — signaling trending conditions.
- MA Ribbon (SMA 20/50/100/200): On the hourly chart, short-term MAs are trending above long-term ones (bullish crossover). On the daily chart, price is trying to break above mid-term MAs, which is a key trend reversal signal.
- Accumulation/Distribution Line (ADL): Currently lagging but not invalidating the uptrend. If this starts to rise alongside price, it will act as confirmation of real buying pressure rather than just speculative pumps.
---> Click here to Trade EOS with Bitget <---
Where Is EOS Price Heading Next?
Given the alignment of hourly breakout and daily resistance testing, EOS price could be entering a transitional phase from accumulation to markup. If it breaks above the $0.66–$0.68 resistance zone, the path to $0.75 and even $0.85 opens up quickly.
However, rejection at these levels could bring a short-term retracement back to the 20-day SMA at $0.548. This would still maintain bullish structure unless the price collapses below $0.52.
EOS Price Prediction: Bull Trap or Breakout?
EOS price is currently at a technical inflection point. The hourly chart supports a short-term breakout, while the daily chart cautiously leans bullish. Volume and on-chain accumulation need to catch up to sustain this rally, but all early signs point toward a legit breakout attempt.
If EOS price can flip the $0.66–$0.68 zone into support, the bullish case becomes dominant. Until then, traders should watch volume closely and consider pullbacks to the $0.58–$0.60 range as potential re-entry zones.
Disclaimer: The content of this article solely reflects the author's opinion and does not represent the platform in any capacity. This article is not intended to serve as a reference for making investment decisions.
You may also like
Ethereum Eyes $4.8K and Beyond After Breakout
Ethereum holds strong after a breakout, keeping the $4.8K target in play with eyes on $8.5K as a potential next stop.Can Ethereum Push to $8.5K Next?What to Watch Going Forward

Qubetics Offers 2789% ROI for Early Buyers as Immutable X and SUI Compete for the Best Coins to Buy This Month
Explore the best coins to buy this month with Qubetics, Immutable X, and SUI. Learn about Qubetics' QubeQode IDE and what sets these projects apart.Qubetics: QubeQode IDE—Empowering Blockchain DevelopersImmutable X: Scaling NFTs for the FutureSUI: A Next-Gen Blockchain with a Unique Consensus MechanismQubeQode IDE: Simplifying Blockchain DevelopmentConclusion

Pi Coin rises 17% after Chainlink integration

Helium tokens surge after SEC drops Nova Labs lawsuit