PENDLE’s Recovery Kicks Off With a Classic Pattern – Will TAO Follow the Same Path?
Date: Sat, April 05, 2025 | 05:30 AM GMT
The cryptocurrency market has been under pressure throughout the first quarter of 2025, with Ethereum (ETH) logging its worst Q1 performance since 2018—down 45%. This steep decline has spilled over into the altcoin market, dragging many tokens into deep corrections.
However, among the chaos, Pendle (PENDLE) is beginning to stand out. The token has managed to gain 20% over the past week, cutting down its 90-day losses to 40%. Meanwhile, Bittensor (TAO) remains one of the hardest-hit altcoins, still down by 60%, but a closer look at its technical structure suggests it might not be far behind in mounting a recovery of its own.
 Source: Coinmarketcap
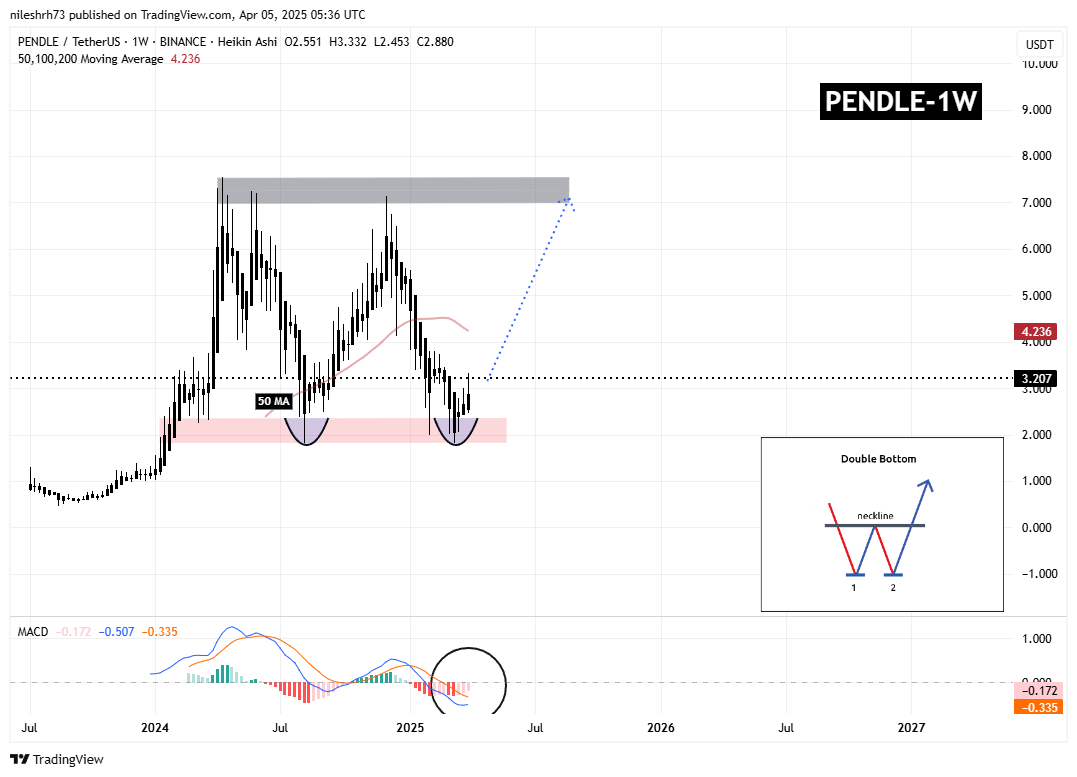
Pendle (PENDLE) – Double Bottom Signals Reversal?
PENDLE’s weekly chart reveals a textbook double-bottom pattern—a classic bullish reversal formation that often marks the end of a prolonged downtrend. The correction for PENDLE began in early December 2024 when it failed to break through the $7.14 neckline, leading to a sharp downward move. This selloff eventually found strong support at $1.81, which became the foundation for the second bottom in this formation.
 Pendle (PENDLE) Weekly Chart/Coinsprobe (Source: Tradingview)
Since reaching this key support, PENDLE has bounced back sharply and is now trading near $3.20, which represents a solid 77% recovery from its recent lows. The current momentum suggests that bulls are regaining control. If this recovery sustains, the next major resistance lies at the 50-week moving average.
A successful breakout above this level could pave the way for a rally back toward the $7.14 neckline, confirming a full pattern breakout and potentially kicking off a new bullish phase.
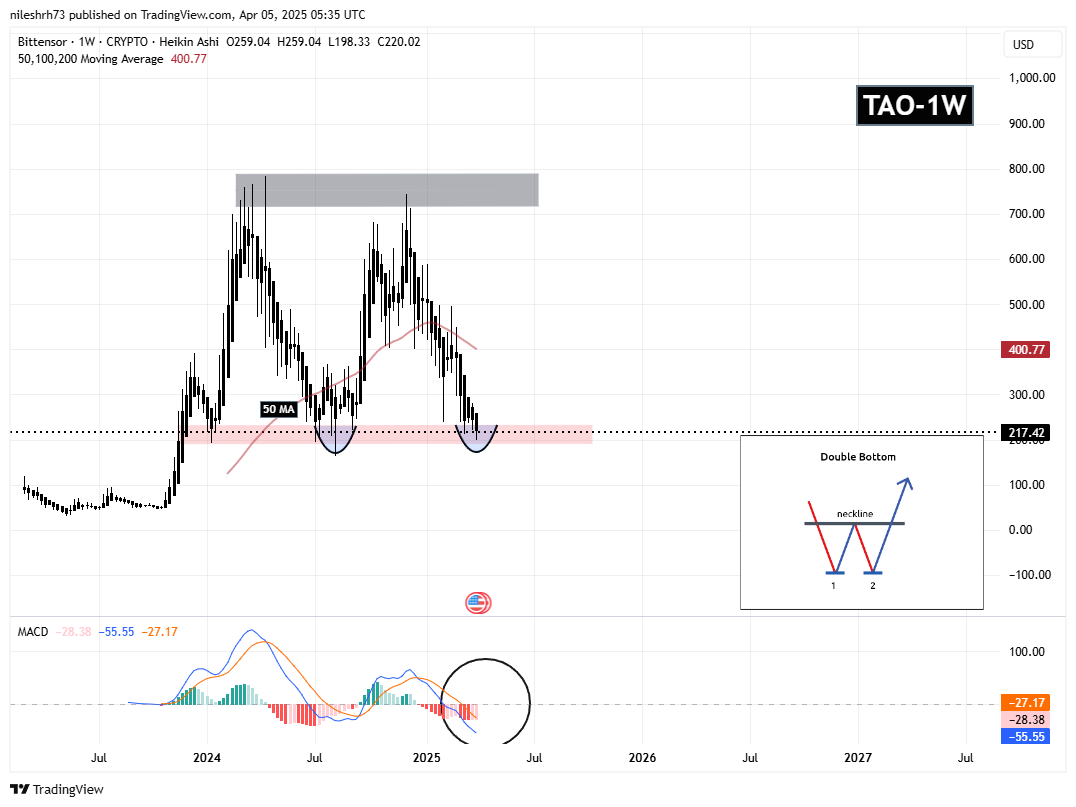
Bittensor (TAO) – Mirroring PENDLE’s Path?
Bittensor (TAO) seems to be setting up a similar narrative. Much like PENDLE, TAO formed its peak in December 2024 after failing to hold above the $743 resistance zone. Since then, the token has undergone a steady and painful decline, finding its footing recently around the $217 level.
 Bittensor (TAO) Weekly Chart/Coinsprobe (Source: Tradingview)
This area of support also aligns with a potential double-bottom structure forming on the weekly chart. If the pattern continues to develop, TAO could be preparing for a bounce similar to PENDLE’s. The 50-week moving average currently acts as the nearest resistance and will be a key level to watch in the coming sessions.
Adding to the bullish case, TAO’s MACD is showing early signs of a bullish crossover, which often precedes upward momentum in price.
What’s Next for PENDLE & TAO?
PENDLE has already kickstarted its recovery, and the structure of its chart suggests this may be more than just a short-term bounce. If buyers can continue to push the price above the 50-week MA and sustain momentum toward the $7.14 resistance, we could see the confirmation of a full trend reversal.
TAO is still lagging behind but might just be one strong weekly candle away from following suit. With the double-bottom structure forming and momentum indicators hinting at a shift, it’s worth watching closely to see if it can replicate PENDLE’s rebound.
Disclaimer: This article is for informational purposes only and not financial advice. Always conduct your own research before investing in cryptocurrencies.
Disclaimer: The content of this article solely reflects the author's opinion and does not represent the platform in any capacity. This article is not intended to serve as a reference for making investment decisions.
You may also like
Ripple Talks ISO 20022—Is XRP the Future of Compliant Payments?

PumpFun Brings Back Livestreaming Feature for 5% of Users

The Scott Lewis Story: Calm Visionary Behind DeFi Pulse

Jim Cramer Predicts Crash Like 1987’s Black Monday
Jim Cramer compares today’s market to 1987’s Black Monday, warning investors of a potential major crash.Cramer Sees History Repeating ItselfSigns of Trouble in the MarketWhat Should Investors Do?

