Bitcoin RSI Recovers, But Breakout Is Needed for Robust Market Reversal

- Bitcoin’s RSI recovery indicates change, but a breakout is still needed.
- Repeated Bollinger Band dips mean Bitcoin follows a cyclical pattern.
- Momentum signals trail past trends, promising an upward price increase.
The Bitcoin price action shows a possible reversal, with leading technical indicators. Analysts highlight significant patterns that could propel the next direction in market action.
Daily RSI Trends and Price Reversal Hopes
Bitcoin’s daily RSI readings have been on the recovery after posting all-time lows. The uptrend suggests increased momentum, but it still hasn’t sparked a full reversal of the trend. Bitcoin has to break its current daily downtrend to record a strong bounce.
According to Rekt Capital, Bitcoin’s RSI has recently dipped below the 25 line, into oversold conditions. The RSI has since crept higher, indicating a shift in sentiment. The price action, though, still hasn’t validated that shift, as Bitcoin remains in a downtrend .
Rekt observed that a breakout of this trendline would be necessary for an upmove. Previous price action states that RSI rallies are usually followed by reversals, but are validated only when price levels breach key resistance zones.
Aside from RSI indications, past price action also provides excellent indications of where Bitcoin is going. Bitcoin had a steep price increase after a consolidation period between November 2022 and March 2023. The same patterns repeated in later months, including steep price rebounds in August 2023 and 2024.
This resistance shows that other indicators, including Bollinger Bands, might also confirm Bitcoin’s price direction. The future of the market will then depend on whether or not Bitcoin will be able to break through resistance and sustain higher prices.
Bollinger Bands and Momentum Indicators
Bollinger Bands and momentum indicators provide additional information about the price action of Bitcoin. The indicators are employed to identify potential reversal points and confirm overall trends of the market.
Ether Nasyonal has provided a comparative price action analysis of Bitcoin over the past few years. Ether noted that local lows have all coincided with price touching the lower Bollinger Band.
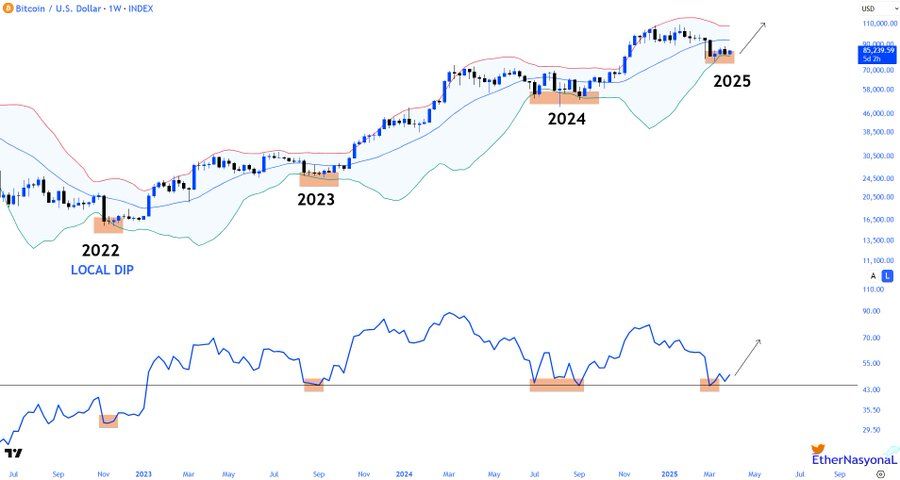
Source: Ether Nasyonal
These occurrences in 2022, 2023, and 2024 resulted in bounce backs, according to a pattern that is typical pattern. His analysis shows that in each case, Bitcoin’s momentum indicator showed oversold conditions and recoveries thereafter.
Consistent with past years, the 2025 price action of Bitcoin follows this customary pattern. The Bitcoin price rose to the lower Bollinger Band before leveling off, as the momentum indicator foresaw potential to the upside.
Ether also suggested that Bitcoin has remained within programmed Bollinger Band channels, confirming the relevance of support and resistance levels. If the present upward momentum is sustained, Bitcoin can break through current resistance levels to enable a stronger rally.
Disclaimer: The content of this article solely reflects the author's opinion and does not represent the platform in any capacity. This article is not intended to serve as a reference for making investment decisions.
You may also like

Up to 50% BGB rebates: Deposit & buy crypto with VND today!
Hang Seng Index falls below 20,000 points
AR falls below $5