Sei (SEI) Holds Key Support After Major Drop — Will This Pattern Trigger a Recovery?

Date: Sat, April 12, 2025 | 07:45 AM GMT
The cryptocurrency market has experienced a turbulent start to 2025. Ethereum (ETH) posted its worst Q1 performance in history, plummeting by 45% and dragging down sentiment across the altcoins . However, optimism is slowly returning following U.S. President Trump’s unexpected announcement of a 90-day tariff pause — a move that injected renewed hope into global risk markets, including crypto.
One altcoin starting to stand out amid the broader recovery is Sei (SEI). The Layer-1 token is gaining traction today after Donald Trump’s project, World Liberty Fi, purchased $775K worth of SEI using USDC.
After dropping over 57% this year alone, SEI has rebounded sharply with a 10% daily gain — and it may now be on the verge of a major bullish reversal.
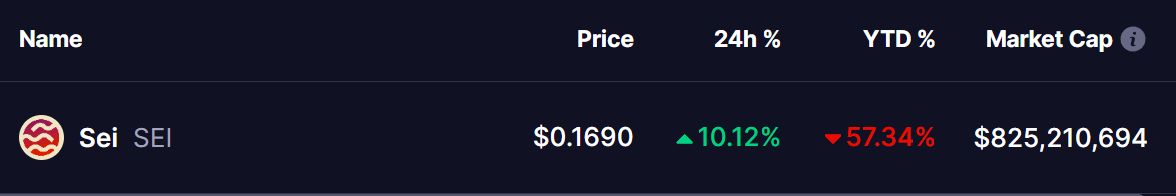 Source: Coinmarketcap
A Rounding Bottom in the Making?
As seen in the weekly chart, SEI experienced a steep correction after its explosive 262% rally in late 2024. The token topped out near $0.7360 in early December before a harsh sell-off dragged it down by more than 82%, eventually finding support around the $0.13 level.
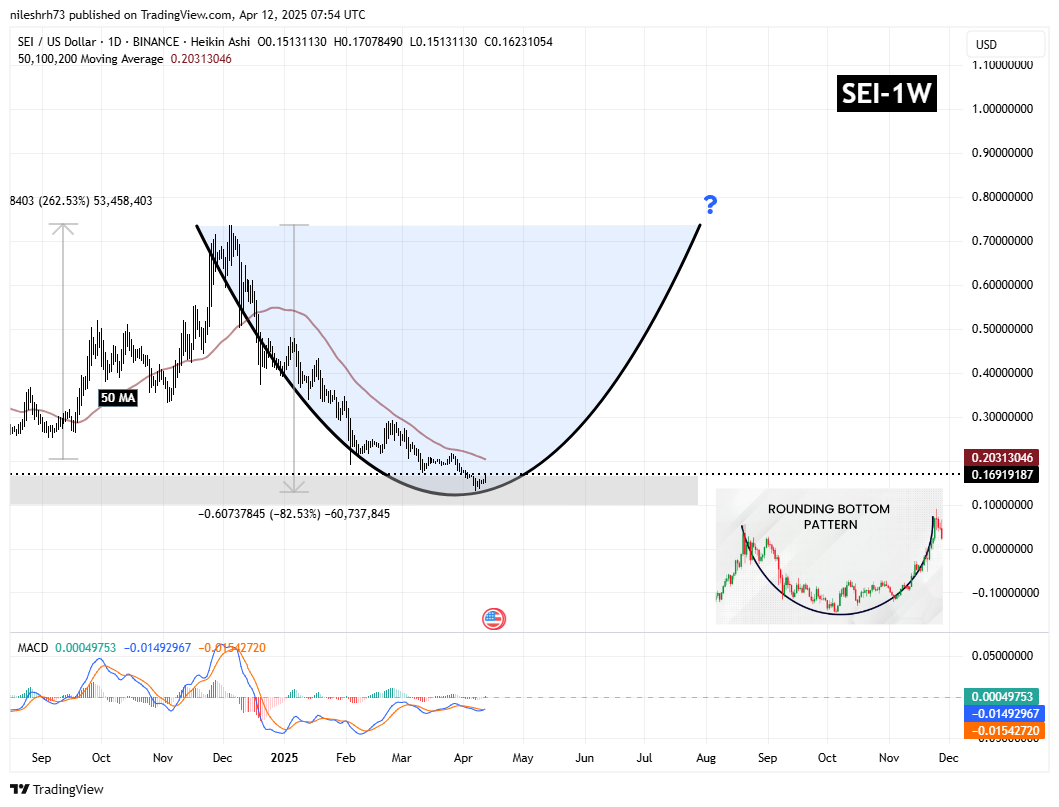 SEI Daily Chart/Coinsprobe (Source: Tradingview)
Now, price action is beginning to hint at the formation of a rounding bottom — a time-tested reversal pattern that typically signals a gradual transition from a bearish to a bullish trend.
The SEI chart displays this curved formation clearly, reflecting a prolonged consolidation phase after a deep decline. The token is currently trading around $0.169, having bounced off its bottom and making a slow, structured climb upward.
Will This Pattern Spark a Recovery?
For the rounding bottom to confirm a trend reversal, SEI must break decisively above the 50-day moving average, which is currently acting as dynamic resistance near $0.20. A successful breakout could open the path toward a retest of the $0.73 zone — its previous high.
Such a breakout would align with historical behavior seen after similar chart structures, where a breach of resistance often fuels a strong, momentum-driven rally. The target based on the depth of the rounding bottom suggests SEI may revisit its prior peak if market sentiment continues to improve.
Adding to the bullish narrative, the MACD indicator is showing early signs of a bullish crossover, where the MACD line begins to rise above the signal line. This shift suggests fading bearish momentum and increasing potential for upside continuation.
Final Thoughts
SEI’s recent resilience and emerging rounding bottom pattern present a compelling case for a potential reversal. If the token can overcome key resistance levels — especially the 50-day MA — it may enter a new bullish phase targeting previous highs near $0.73.
However, it’s essential to remain cautious. A failure to break resistance or a loss of support could result in renewed selling pressure. Traders and investors should monitor the next few weeks closely, as the current setup could define SEI’s medium-term direction.
Disclaimer: This article is for informational purposes only and does not constitute financial advice. Always perform your own due diligence before making any investment decisions in the cryptocurrency market.
Disclaimer: The content of this article solely reflects the author's opinion and does not represent the platform in any capacity. This article is not intended to serve as a reference for making investment decisions.
You may also like
Ethereum ETFs See $5.98M Dip, But $2.27B Cumulative Inflow Signals Stability

AI16Z token launches Auto.fun this week

NVIDIA plans $500 billion AI factory buildout in US

Crypto funds lose $795 million amid tariff uncertainty