Stellar (XLM) Mirrors Past Bullish Setup – Is This the Final Dip Before Takeoff?

Date: Tue, April 15, 2025 | 10:30 AM GMT
The cryptocurrency market has faced a sharp correction phase, where Ethereum (ETH) itself recorded its worst Q1 decline since 2018 — plummeting by a staggering 45%. This widespread weakness has weighed heavily on altcoins , triggering sharp drops and investor concerns across the board.
Among the hardest-hit altcoins, Stellar (XLM) has shed 47% of its value in just the last 90 days. But the market is now showing signs of life, pushing sentiment higher and triggering sharp gains across the board, including a 5% jump for XLM in the past 7 days — and now, the current price action is beginning to resemble a familiar pattern that played out just before its explosive rally back in late 2017.
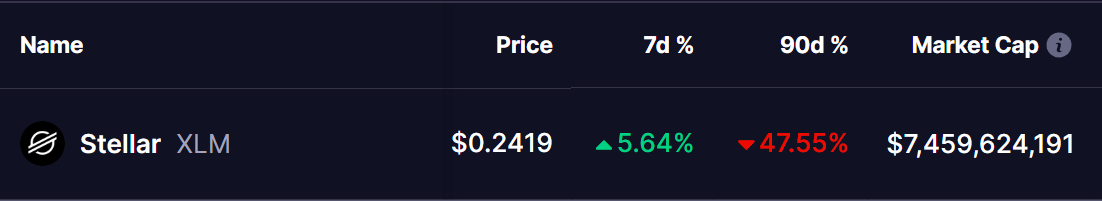 Source: Coinmarketcap
XLM’s Chart Mirrors Past Price Behavior
In late 2017, Stellar (XLM) pulled off one of the most explosive moves of the cycle, rallying over 3500% from a base of around $0.0025 to nearly $0.07 within just a few months. But as quickly as the pump came, it faded — XLM corrected sharply, dropping over 81% and bottoming out near $0.011.
What stood out, however, was what happened next. The 50-week moving average acted as a key support level, halting the decline and setting the stage for a massive reversal. From that base, XLM went on an unexpected tear, rallying more than 4900% and cementing its status as one of the top-performing altcoins of that bull run.
Now in 2025, the chart structure is eerily similar. XLM kicked off this cycle with an explosive move from around $0.09 to a peak of $0.64 — a gain of more than 600%. Following that, it entered a sharp corrective phase, shedding 67% of its value, before stabilizing.
Once again, the token has returned to the 50-week moving average — and just like in 2017, it’s finding support at this level. This critical zone, marked again by a circle in the current chart, is now acting as a potential launchpad.
Since touching this support, XLM has started to recover steadily, forming higher lows and gaining bullish momentum. This week, the token is trading above $0.24, showing consistent buying pressure and sparking hopes that history may be repeating itself.
Will XLM History Repeat?
Is this the final dip before takeoff? With the 50W MA holding strong and momentum picking up, XLM could be gearing up for another breakout. If history repeats, a major move may be just around the corner.
Disclaimer: This article is for informational purposes only and not financial advice. Always conduct your own research before investing in cryptocurrencies.
Disclaimer: The content of this article solely reflects the author's opinion and does not represent the platform in any capacity. This article is not intended to serve as a reference for making investment decisions.
You may also like
Cardano Foundation Partners with PUC-Rio for Blockchain Research
Polychain and B2C2 deposited 5,700 ETH and 6,540 ETH respectively to exchanges in the past 24 hours
US spot Ethereum ETF had a net outflow of $14.2 million yesterday
South Korean lawmakers propose tighter regulations on speculative cryptocurrency chatrooms