Bitget: топ-4 за щоденним обсягом торгівлі!
Частка ринку BTC63.30%
Нові лістинги на Bitget : Pi Network
BTC/USDT$94292.97 (+1.94%)Індекс страху та жадібності60(Жадібність)
Індекс сезону альткоїнів:0(Сезон Bitcoin)
Монети, що представлені на премаркетіINITЗагальний чистий приплив коштів у спотові ETF на Bitcoin +$442M (1 д.); +$2.59B (7 дн.).Вітальний подарунковий пакет для нових користувачів вартістю 6200 USDT.Отримати
Торгуйте в будь-який час у будь-якому місці через застосунок Bitget. Завантажити


Ціна The Infinite GardenETH
Не представлено на платформі
Валюта котирування:
UAH
Дані отримані від сторонніх постачальників. Ця сторінка та надана на ній інформація не є висловленням підтримки жодної конкретної криптовалюти. Хочете торгувати монетами, представленими на біржі? Клацніть тут
₴0.1642+64.56%1D
Ціна
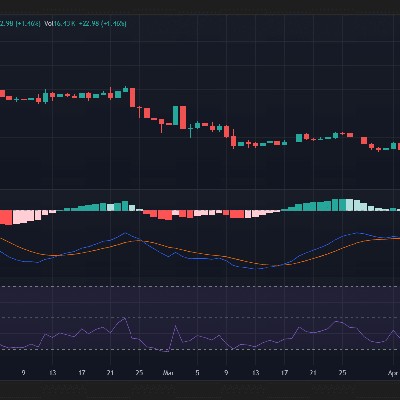
Графік цін The Infinite Garden (ETH/UAH)
Останнє оновлення 2025-04-25 11:47:22(UTC+0)
Ринкова капіталізація:--
Повністю розбавлена ринкова капіталізація:--
Обсяг (24 г):--
Обсяг за 24 г / Ринкова капіталізація:0.00%
Макс. за 24 г:₴0.2179
Мін. за 24 год:₴0.1198
Історичний максимум:₴11.19
Історичний мінімум:₴0.04182
Циркулююча пропозиція:-- ETH
Загальна пропозиція:
10,000,000ETH
Показник обігу:0.00%
Максимальна пропозиція:
10,000,000ETH
Ціна в BTC:0.{7}4167 BTC
Ціна в ETH:1 ETH
Ціна за ринковою капіталізацією BTC:
--
Ціна за ринковою капіталізацією ETH:
--
Контракти:
0x5e21...378d613(Ethereum)
Більше
Як ви ставитеся до The Infinite Garden сьогодні?
Примітка. Ця інформація надається лише для ознайомлення.
Аналітичний ШІ-звіт про The Infinite Garden
Основні події ринку криптовалют за сьогодніПереглянути звіт
Ціна The Infinite Garden в UAH сьогодні
Сьогодні актуальна ціна The Infinite Garden становить ₴0.1642 UAH, з поточною ринковою капіталізацією ₴0.00. Ціна The Infinite Garden зросла на 64.56% за останні 24 години, а обсяг торгівлі за 24 години склав ₴0.00. Коефіцієнт конвертації ETH/UAH (The Infinite Garden – UAHоновлюється в реальному часі.
Історія ціни The Infinite Garden (UAH)
За останній рік ціна The Infinite Garden зросла на -96.27%. Найвища ціна в UAH минулого року була ₴8.2, а найнижча ціна в UAH — ₴0.1114.
ЧасЗміна ціни (%) Найнижча цінаНайвища ціна
Найнижча цінаНайвища ціна 24h+64.56%₴0.1198₴0.2179
7d+39.06%₴0.1162₴0.2179
30d+1.50%₴0.1162₴0.2302
90d-22.94%₴0.1114₴0.6893
1y-96.27%₴0.1114₴8.2
За весь час-94.71%₴0.04182(2024-01-14, 1 р. тому )₴11.19(2024-03-13, 1 р. тому )
Яка найвища ціна The Infinite Garden?
Максимальна ціна (ATH) The Infinite Garden у UAH становила ₴11.19 і була зафіксована 2024-03-13. Порівняно з ATH The Infinite Garden, поточна ціна The Infinite Garden знизилася на 98.53%.
Яка найнижча ціна The Infinite Garden?
Мінімальна ціна (ATL) The Infinite Garden у UAH становила ₴0.04182 і була зафіксована 2024-01-14. Порівняно з ATL The Infinite Garden, поточна ціна The Infinite Garden збільшилася на 292.55%.
Прогноз ціни The Infinite Garden
Якою буде ціна ETH у 2026?
Ґрунтуючись на моделі прогнозування історичних показників ETH, ціна ETH може досягти ₴0.2093 у ₴0.2093 році.
Якою буде ціна ETH у 2031?
У 2031 ціна ETH може зрости на +35.00%. Прогнозується, що до кінця 2031 ціна ETH досягне ₴0.4596, а сукупна ROI становитиме +179.98%.
Відповіді на поширені запитання
Яка поточна ціна The Infinite Garden?
Актуальна ціна The Infinite Garden становить ₴0.16 за (ETH/UAH), актуальна ринкова капіталізація становить ₴0 UAH. Вартість The Infinite Garden часто коливається через безперервну активність на криптовалютному ринку. Актуальну ціну The Infinite Garden в режимі реального часу та дані на історії ви завжди можете переглянути на Bitget.
Який обсяг торгівлі The Infinite Garden за 24 години?
За останні 24 години обсяг торгівлі The Infinite Garden становить ₴0.00.
Який історичний максимум The Infinite Garden?
Історичний максимум The Infinite Garden становить ₴11.19. Цей історичний максимум є найвищою ціною для The Infinite Garden з моменту його запуску.
Чи можу я купити The Infinite Garden на Bitget?
Так, The Infinite Garden зараз можна придбати на централізованій біржі Bitget. Щоб отримати докладніші інструкції, перегляньте наш корисний посібник Як купити .
Чи можу я отримувати постійний дохід від інвестування в The Infinite Garden?
Звичайно, Bitget забезпечує платформа для стратегічної торгівлі з розумними торговими ботами для автоматизації ваших угод і отримання прибутку.
Де можна купити The Infinite Garden за найнижчою комісією?
Ми раді повідомити, що платформа для стратегічної торгівлі тепер доступний на Bitget. Bitget пропонує найкращі комісії за торгівлю та глибину ринку, щоб забезпечити прибутковість інвестицій для трейдерів.
Баланс The Infinite Garden
Матриця розподілу утримань The Infinite Garden
Утримання The Infinite Garden за концентрацією
Кити
Інвестори
Рітейл
Адреси The Infinite Garden за часом утримання
Холдери
Cruisers
Трейдери
Графік ціни coinInfo.name (12) у режимі реального часу

Міжнародні ціни The Infinite Garden
Скільки зараз коштує The Infinite Garden в інших валютах? Останнє оновлення: 2025-04-25 11:47:22(UTC+0)
ETH до MXN
Mexican Peso
Mex$0.08ETH до GTQGuatemalan Quetzal
Q0.03ETH до CLPChilean Peso
CLP$3.67ETH до UGXUgandan Shilling
Sh14.43ETH до HNLHonduran Lempira
L0.1ETH до ZARSouth African Rand
R0.07ETH до TNDTunisian Dinar
د.ت0.01ETH до IQDIraqi Dinar
ع.د5.15ETH до TWDNew Taiwan Dollar
NT$0.13ETH до RSDSerbian Dinar
дин.0.41ETH до DOPDominican Peso
RD$0.23ETH до MYRMalaysian Ringgit
RM0.02ETH до GELGeorgian Lari
₾0.01ETH до UYUUruguayan Peso
$0.16ETH до MADMoroccan Dirham
د.م.0.04ETH до AZNAzerbaijani Manat
₼0.01ETH до OMROmani Rial
ر.ع.0ETH до KESKenyan Shilling
Sh0.51ETH до SEKSwedish Krona
kr0.04ETH до UAHUkrainian Hryvnia
₴0.16- 1
- 2
- 3
- 4
- 5
Нові лістинги на Bitget
Нові лістинги

Купити більше


Де можна купити криптовалюту?
Купуйте криптовалюту в застосунку Bitget
Щоб купити криптовалюту за допомогою кредитної картки або банківського переказу, вам потрібно зареєструватися. Це займе всього кілька хвилин.
Video section — Швидка верифікація, швидке здійснення угод

Як пройти верифікацію особи на Bitget та захистити себе від шахрайства
1. Увійдіть у свій акаунт Bitget.
2. Якщо ви ще не маєте акаунта на Bitget, перегляньте нашу інструкцію.
3. Наведіть курсор на значок вашого профілю, клацніть «Не верифікований», а потім «Верифікувати».
4. Оберіть країну або регіон, де ви отримали посвідчення особи, та тип посвідчення. Далі дотримуйтесь підказок на екрані.
5. Виберіть «Верифікація з мобільного» або «ПК».
6. Введіть свої дані, надішліть копію посвідчення особи та зробіть селфі.
7. Після цього подайте заявку, та все готово.
Інвестиції в криптовалюту, включаючи купівлю The Infinite Garden онлайн через Bitget, підлягають ринковому ризику. Bitget надає вам прості та зручні способи купівлі The Infinite Garden, і ми намагаємося максимально повно інформувати наших користувачів про кожну криптовалюту, яку ми пропонуємо на біржі. Однак ми не несемо відповідальності за результати, які можуть виникнути в результаті купівлі The Infinite Garden. Ця сторінка та будь-яка інформація, що тут міститься, не є схваленням будь-якої конкретної криптовалюти.
Оцінки The Infinite Garden
Середні оцінки від спільноти
5
Цей контент призначено лише для інформаційних цілей.
Bitget Insights

POOR-PEOPLE
5год
$CLAY $CLAY You know that there's a community on $TON that works 24/7 👀
There's an update coming soon in Clayton's Mini App
👻📈🏆
$INIT $DEEP $FLM $TOMA $BROCCOLI $TON $SOL $WHY $BTC $ETH $MAK $MDOGS $CATS $MCH $HALO $FIRE $PEOPLE
BTC+0.33%
TOMA+2.14%
POOR-PEOPLE
5год
$CLAY You know that there's a community on $TON that works 24/7 👀
There's an update coming soon in Clayton's Mini App
👻📈🏆
$INIT $DEEP $FLM $TOMA $BROCCOLI $TON $SOL $WHY $BTC $ETH $MAK $MDOGS $CATS $MCH $HALO $FIRE $PEOPLE
BTC+0.33%
TOMA+2.14%

CryptoT
5год
🚀 #Bitcoin Update: $94.5K Target Hit—What’s Next? 📉💥
#CryptoFam, our last call on April 24 nailed it! 🎯 BTC surged past $92.9K and hit our target of $94.5K, reaching a high of $94,464! 🔥
However, the bulls couldn’t hold the momentum, and BTC has pulled back to $93,253 on the 1H chart, down 0.82%. Let’s break it down!
💪 Key Levels to Watch:
Resistance: $94,464 (recent high)—a break above could signal a push toward $95K+.
Support:
Immediate support at $92.9K (around $92,843 on the chart), a level that previously acted as
resistance.
Major support at $91,527–$91,536, aligning with the $91.5K level we highlighted last time. This zone also coincides with the ascending trendline.
🎯 What’s Next?
BTC is at a critical juncture. The price is hovering just above the $92.9K support. If it holds here, we might see a bounce back toward $94.5K, with a potential new leg up to $95K or higher.
However, if $92.9K fails, the next key support at $91.5K becomes crucial. A break below $91.5K could bring $90K back into play, as mentioned in our last update—stay sharp, traders!
What’s your next move? Drop your thoughts below! 🗣️💬
$BTC $ETH $BGB 💪🌟
#BTC #CryptoTrading #Bitget
BTC+0.33%
HOLD+1.31%
sxontz
5год
⚙️ Why We’re Ditching Ethereum Tools, But Still Holding $ETH Like Digital Gold 🪙
In the heart of crypto innovation, the tides are shifting again.
For years, Ethereum has been the go-to chain for building — smart contracts, dApps, DeFi, NFTs — you name it. But behind the scenes, many firms are quietly reaching their limit.
⚠️ High gas fees
🐌 Slow transactions
💸 Costly operations
That’s the breaking point.
So what are firms doing? They’re migrating.
Chains like SUI ⚡, SOL ☀️, IP 🌐, and even bold experiments like HYPER 🚀 and FARTCOIN 💨 are gaining traction. They're faster, cheaper, and friendlier to devs. OGs like ADA ⛓️ and new faces like PAWS 🐾 and EPT 🧠 are joining the arena.
But here’s the kicker:
They’re dropping the tools, not the coin.
Despite the pivot from Ethereum’s dev stack, $ETH remains a digital treasure:
💧 Liquid — easy to move, easy to trade
🛠️ Useful — staking, DeFi, collateral
🏆 Respected — the silver to Bitcoin’s gold
So yes, firms are hedging. They're testing on SUI and playing with $BGB or $FARTCOIN for speed and novelty...
But they’re still holding ETH.
Because in a world of ever-shifting tech, you need a rock in your portfolio.
Think of it like this:
🛠️ Swapping out the wrench,
🏅 But keeping the gold in the vault.
In Our Bags This Cycle:
$BTC 🟠 $ETH ⚙️ $PAWS 🐾 $EPT 🧠 $FARTCOIN 💨 $ADA ⛓️ $IP 🌐 $SUI ⚡ $SOL ☀️ $BGB 💎 $HYPER 🚀
BTC+0.33%
BGB+0.92%
sunny-B
5год
Understanding stablecoins
Popular cryptocurrencies like Bitcoin
BTC
$93,289
and Ether
ETH
$1,766
tend to suffer from high volatility. Volatility refers to the amount of uncertainty related to the changes in the value of an asset. A higher volatility means the asset’s price can swing wildly over time in either direction, while lower volatility means its price is relatively stable.
Volatility can be measured in quantifiable daily returns by looking at an asset's percentage in points (pips) movements. Even the leading cryptocurrencies often move over 10% during periods of market turmoil, affecting their use as mediums of exchange. An asset as a medium of exchange means it can facilitate the purchase and sale of goods and services.
To be used as a currency, an asset is expected to act as a medium of exchange, a unit of account and a store of value, meaning an asset has to maintain its value, be used to value goods and services and facilitate commerce. The most apparent benefit of stablecoin technology is that it can be used as a medium of exchange, bridging the gap between fiat and cryptocurrencies. Stablecoins can reach a utility entirely different from the ownership of legacy cryptocurrencies by reducing price volatility.
Stablecoins are inherently stable assets, making them a good store of value and encouraging their adoption in regular transactions. Stablecoins also increase the mobility of crypto assets around the ecosystem.
Stablecoin and fiat currency holders know that the purchasing power of their holdings won’t change over short periods of time and can be used to buy goods and services. Stablecoins set themselves apart by being blockchain-based, as described above.
The value of most stablecoins is pegged to the value of either a specific fiat currency such as the United States dollar or a particular commodity such as gold. Being pegged means that their price is fixed, so one stablecoin tracking the U.S. dollar should be worth one dollar.
This peg can be maintained through a number of different mechanisms. The most common method used by stablecoins is called asset backing. Asset backing refers to the total amount of stablecoin tokens in circulation with respect to the number of assets backing it. A stablecoin is backed 1:1 if, for every stablecoin in circulation, there are assets worth an equivalent amount backing it.
In the case of stablecoins backed by a U.S. dollar, it’ll keep its value as long as the stablecoin is redeemable for the U.S. dollar. However, if its value moves sharply in either direction, traders looking to profit off of price differences between markets will step in to close the gap.$BTC $ETH
BTC+0.33%
MOVE+0.96%
Пов'язані активи
Популярні криптовалюти
Підбірка з 8 найкращих криптовалют за ринковою капіталізацією.


Нещодавно додано
Останні додані криптовалюти.


Порівнювана ринкова капіталізація
Серед усіх активів на Bitget ці 8 найближчі до The Infinite Garden за ринковою капіталізацією.


Додаткова інформація про The Infinite Garden
Пов'язано з монетами
Пов'язано з торгівлею
Оновлення монет
