Bitget App
交易「智」變
快速買幣市場交易合約BOT理財跟單
Aethir 價格

Aethir 價格ATH

focusIcon
subscribe
上架
買入
報價幣種:
TWD

您今天對 Aethir 感覺如何?

IconGood良好IconBad糟糕
注意:此資訊僅供參考。

Aethir 今日價格

Aethir 的即時價格是今天每 (ATH / TWD) NT$1.1,目前市值為 NT$8.65B TWD。24 小時交易量為 NT$1.91B TWD。ATH 至 TWD 的價格為即時更新。Aethir 在過去 24 小時內的變化為 -5.08%。其流通供應量為 7,899,323,000 。

ATH 的最高價格是多少?

ATH 的歷史最高價(ATH)為 NT$21.3,於 2024-06-12 錄得。

ATH 的最低價格是多少?

ATH 的歷史最低價(ATL)為 NT$0.9732,於 2025-02-03 錄得。
計算 Aethir 收益

Aethir 價格預測

什麼時候是購買 ATH 的好時機? 我現在應該買入還是賣出 ATH?

在決定買入還是賣出 ATH 時,您必須先考慮自己的交易策略。長期交易者和短期交易者的交易活動也會有所不同。Bitget ATH 技術分析 可以提供您交易參考。
根據 ATH 4 小時技術分析,交易訊號為 強力賣出
根據 ATH 1 日技術分析,交易訊號為 賣出
根據 ATH 1 週技術分析,交易訊號為 強力賣出

ATH 在 2026 的價格是多少?

根據 ATH 的歷史價格表現預測模型,預計 ATH 的價格將在 2026 達到 NT$1.15

ATH 在 2031 的價格是多少?

2031,ATH 的價格預計將上漲 +37.00%。 到 2031 底,預計 ATH 的價格將達到 NT$1.99,累計投資報酬率為 +70.96%。

Aethir 價格歷史(TWD)

過去一年,Aethir 價格上漲了 -47.76%。在此期間,ATH 兌 TWD 的最高價格為 NT$21.3,ATH 兌 TWD 的最低價格為 NT$0.9732。
時間漲跌幅(%)漲跌幅(%)最低價相應時間內 {0} 的最低價。最高價 最高價
24h-5.08%NT$1.09NT$1.21
7d+1.24%NT$1.06NT$1.22
30d-0.08%NT$1.03NT$1.56
90d-50.10%NT$0.9732NT$2.6
1y-47.76%NT$0.9732NT$21.3
全部時間-47.76%NT$0.9732(2025-02-03, 53 天前 )NT$21.3(2024-06-12, 289 天前 )

Aethir 市場資訊

Aethir 市值走勢圖

市值
NT$8,650,536,116.13
完全稀釋市值
NT$45,994,135,412.95
排名
ICO 價格
NT$0.4307 ICO 詳情
立即購買 Aethir

Aethir 行情

  • #
  • 幣對
  • 類型
  • 價格
  • 24 小時交易量
  • 操作
  • 1
  • ATH/USDT
  • 現貨
  • 0.03303
  • $5.76M
  • ‌交易
  • Aethir 持幣分布集中度

    巨鯨
    投資者
    散戶

    Aethir 地址持有時長分布

    長期持幣者
    游資
    交易者
    coinInfo.name(12)即時價格表
    loading

    Aethir 評級

    社群的平均評分
    4.4
    102 筆評分
    此內容僅供參考。

    Aethir (ATH) 簡介

    什麼是 Aethir

    Aethir 是一個於 2024 6 月推出的雲端運算平台。它旨在改變 GPU 所有權、分配和使用的傳統模式。Aethir 透過利用去中心化框架,解決了與集中式雲端運算相關的低效率和高成本問題。此平台使各行業的企業和開發人員能夠以極低的成本獲得強大的運算資源,進而培育更公平和高效的技術環境。

    Aethir 專注於最大限度地利用圖形處理單元 (GPU) 來執行人工智慧 (AI)、機器學習 (ML) 和雲端遊戲等運算密集型任務。透過利用未充分利用的 GPU 容量,Aethir 建立了一個可擴展且具有競爭性的環境,使高階運算能力的取得變得民主化,為新的經濟機會和技術進步鋪平了道路。Aethir 吸引了著名創投公司的大力支持,包括 IVCAnimoca BrandsGate.ioBybit Hashkey Group 等。

    相關頁面

    官方文件: https://docs.aethir.com/

    白皮書: https://aethir.gitbook.io/aethir/ljvx8d8ee4ElPliP31K1

    官方網站: https://www.aethir.com/

    Aethir 是如何運作的?

    Aethir 在分散的雲端基礎設施上運行,並將單獨的 GPU 叢集整合到統一網路中。這種架構允許無縫連接和資源共享,提高系統的可靠性和彈性。透過匯集各個貢獻者的資源,Aethir 能夠以顯著降低的成本提供強大的運算能力,使其成為具有高處理需求行業的理想解決方案。

    該平台採用獨特的去中心化所有權模式,用戶可以將閒置的 GPU 貢獻給網路。然後,這個集體資源池可供企業和開發人員使用,他們可以利用這些資源來滿足其運算需求。Aethir 的去中心化性質確保了更廣泛的可用性,並減少了對主要雲端供應商的依賴,進而培育了更多樣化和互聯的數位生態系統。

    Aethir 的操作框架圍繞著三個關鍵角色:容器、索引器和檢查器。容器 (Containers) 提供即時遠端渲染服務,這對於雲端遊戲等應用程式至關重要。索引器 (Indexers) 充當媒合者,根據效能、延遲和成本,將用戶與最合適的容器連結起來。檢查器 (Checkers) 維護容器的完整性和效能,確保符合網路標準和服務品質。

    什麼是 ATH 代幣?

    ATH Aethir 生態系的原生代幣,是其生態系的基本組成部分。它促進平台內的各種交易,包括 GPU 資源的支付、質押和治理參與。用戶可以有效地存取和支付服務費用,避免與傳統金融系統相關的複雜性和費用。

    ATH 代幣在 Aethir 網路的治理中也扮演著至關重要的角色。代幣持有者可以參與決策過程,對塑造平台未來的提案和協議升級進行投票。這種去中心化的治理模式確保網路保持社群驅動,並與用戶的利益保持一致。此外,ATH 代幣激勵參與者維護 Aethir 網路的安全和品質。ATH 的總供應量為 420 億枚

    Aethir 是個好的投資嗎?

    對去中心化雲端運算和區塊鏈技術感興趣的人來說,投資 Aethir 可能是一個充滿希望的機會。該平台利用未充分利用的 GPU 資源的創新方法、解決了傳統雲端服務效率低下的問題,有可能大幅降低成本並實現高效能運算的民主化。這使得 Aethir 對於尋求可擴展、經濟高效解決方案的企業和開發人員來說是一個有吸引力的選擇。

    然而,與所有投資一樣,在做出任何財務承諾之前進行徹底的研究(DYOR - 自己進行研究)至關重要。ATH 代幣的價值和實用性雖然有希望,但取決於 Aethir 網路的持續成長和採用情況。潛在投資者應仔細考慮平台的長期潛力、市場狀況和相關風險,以做出明智的決定。

    如何購買 AethirATH)?

    想投資 AethirATH)嗎?只需 2 分鐘,即可 Bitget 上建立帳戶 ,並開始交易 ATH

    Aethir 的相關文章:

    Aethir ATH ): GPU 資源存取的民主化之旅

    如何購買 Aethir(ATH)

    建立您的免費 Bitget 帳戶

    建立您的免費 Bitget 帳戶

    使用您的電子郵件地址/手機號碼在 Bitget 註冊,並建立強大的密碼以確保您的帳戶安全
    認證您的帳戶

    認證您的帳戶

    輸入您的個人資訊並上傳有效的身份照片進行身份認證
    將 Aethir 兌換為 ATH

    將 Aethir 兌換為 ATH

    我們將為您示範使用多種支付方式在 Bitget 上購買 Aethir

    交易 ATH 永續合約

    在 Bitget 上註冊並購買 USDT 或 ATH 後,您可以開始交易衍生品,包括 ATH 合約和槓桿交易,增加收益。

    ATH 的目前價格為 NT$1.1,24 小時價格變化為 -5.08%。交易者可透過做多或做空 ATH 合約獲利。

    ATH 合約交易指南

    跟單交易專家,進行 ATH 跟單交易!

    在 Bitget 註冊並成功購買 USDT 或 ATH 後,您還可以跟單交易專家開始跟單交易。

    Aethir 動態

    流動性持續緊縮,牛回頭還是牛到頭?
    流動性持續緊縮,牛回頭還是牛到頭?

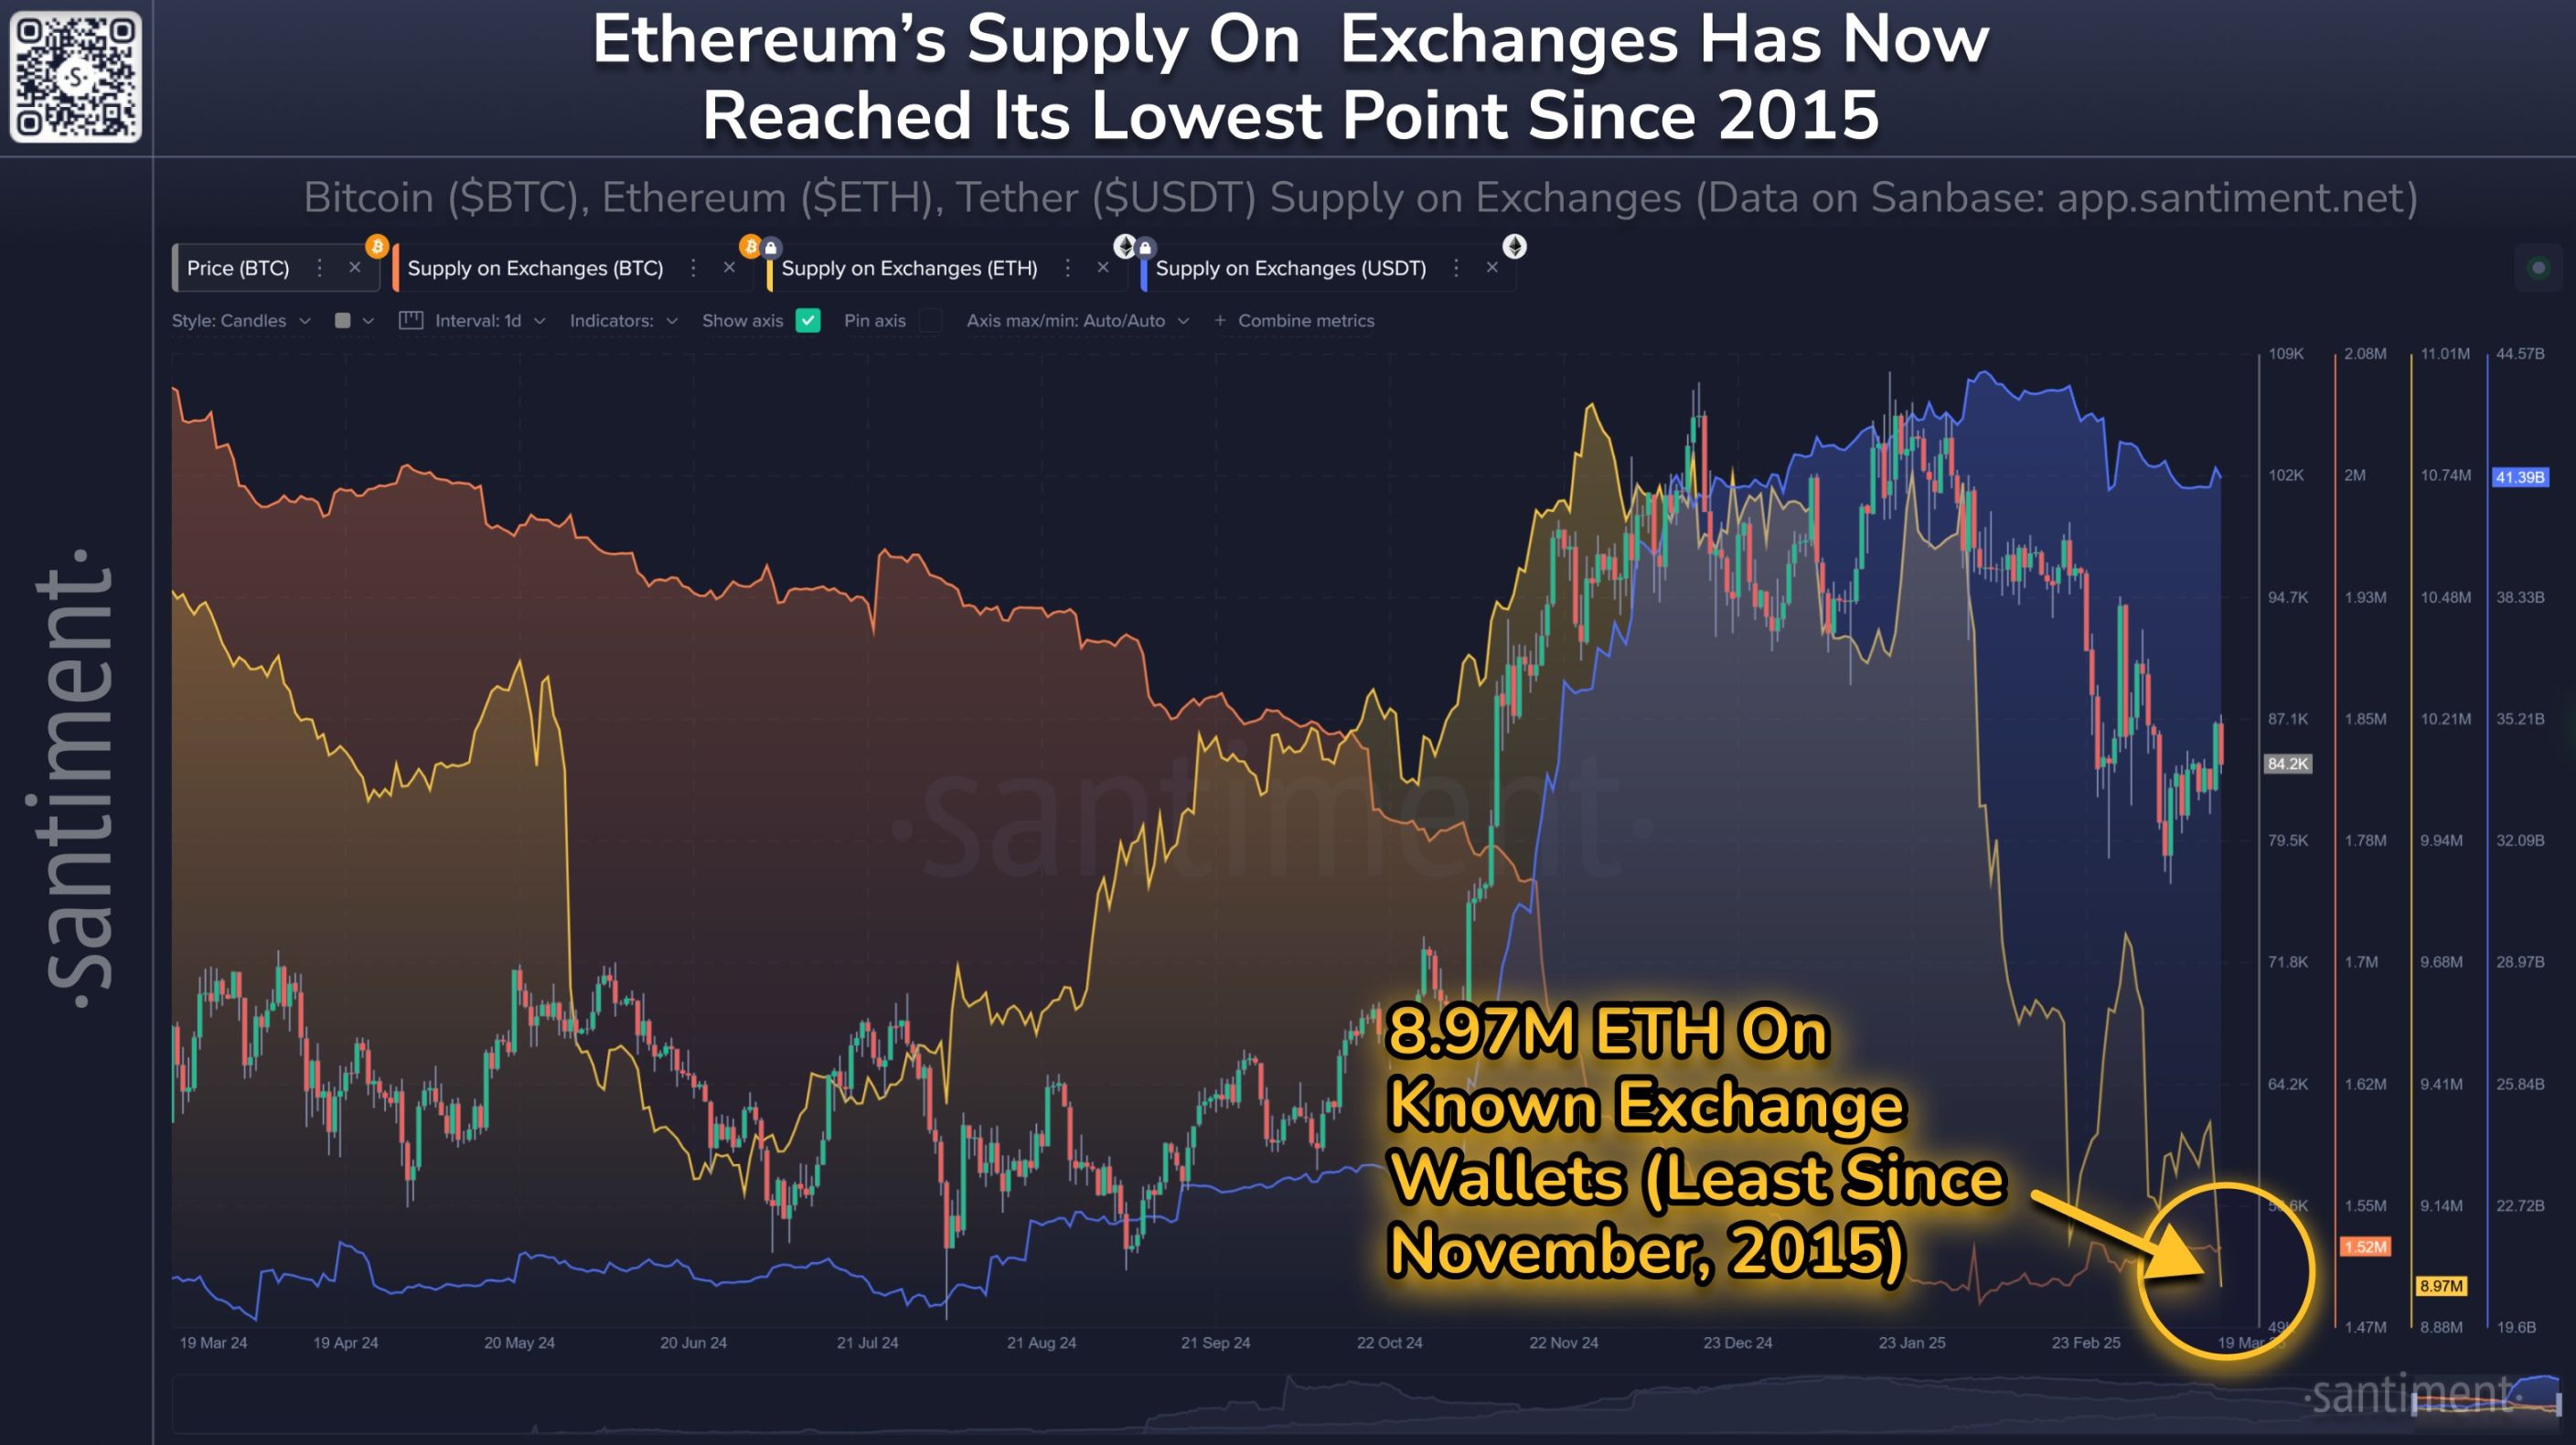
    僅以 MVRV 比率來看,ETH 已處於熊市水平。

    Chaincatcher2025-03-24 05:33
    Aethir 和 Xsolla 宣布推出 1 萬美元資助計劃,支持遊戲開發者
    Aethir 和 Xsolla 宣布推出 1 萬美元資助計劃,支持遊戲開發者

    簡單來說 Aethir 與 Xsolla 合作推出了一項 1 萬美元的生態系統資助計劃,旨在支援需要 GPU 運算服務和雲端遊戲分發管道的視訊遊戲開發商。

    Mpost2025-03-08 02:44
    更多 Aethir 動態

    用戶還在查詢 Aethir 的價格。

    Aethir 的目前價格是多少?

    Aethir 的即時價格為 NT$1.1(ATH/TWD),目前市值為 NT$8,650,536,116.13 TWD。由於加密貨幣市場全天候不間斷交易,Aethir 的價格經常波動。您可以在 Bitget 上查看 Aethir 的市場價格及其歷史數據。

    Aethir 的 24 小時交易量是多少?

    在最近 24 小時內,Aethir 的交易量為 NT$1.91B。

    Aethir 的歷史最高價是多少?

    Aethir 的歷史最高價是 NT$21.3。這個歷史最高價是 Aethir 自推出以來的最高價。

    我可以在 Bitget 上購買 Aethir 嗎?

    可以,Aethir 目前在 Bitget 的中心化交易平台上可用。如需更詳細的說明,請查看我們很有幫助的 如何購買 aethir 指南。

    我可以透過投資 Aethir 獲得穩定的收入嗎?

    當然,Bitget 推出了一個 策略交易平台,其提供智能交易策略,可以自動執行您的交易,幫您賺取收益。

    我在哪裡能以最低的費用購買 Aethir?

    Bitget提供行業領先的交易費用和市場深度,以確保交易者能够從投資中獲利。 您可通過 Bitget 交易所交易。

    您可以在哪裡購買 Aethir(ATH)?

    透過 Bitget App 購買
    數分鐘完成帳戶註冊,即可透過信用卡或銀行轉帳購買加密貨幣。
    Download Bitget APP on Google PlayDownload Bitget APP on AppStore
    透過 Bitget 交易所交易
    將加密貨幣存入 Bitget 交易所,交易流動性大且費用低

    影片部分 - 快速認證、快速交易

    play cover
    如何在 Bitget 完成身分認證以防範詐騙
    1. 登入您的 Bitget 帳戶。
    2. 如果您是 Bitget 的新用戶,請觀看我們的教學,以了解如何建立帳戶。
    3. 將滑鼠移到您的個人頭像上,點擊「未認證」,然後點擊「認證」。
    4. 選擇您簽發的國家或地區和證件類型,然後根據指示進行操作。
    5. 根據您的偏好,選擇「手機認證」或「電腦認證」。
    6. 填寫您的詳細資訊,提交身分證影本,並拍攝一張自拍照。
    7. 提交申請後,身分認證就完成了!
    加密貨幣投資(包括透過 Bitget 線上購買 Aethir)具有市場風險。Bitget 為您提供購買 Aethir 的簡便方式,並且盡最大努力讓用戶充分了解我們在交易所提供的每種加密貨幣。但是,我們不對您購買 Aethir 可能產生的結果負責。此頁面和其包含的任何資訊均不代表對任何特定加密貨幣的背書認可,任何價格數據均採集自公開互聯網,不被視為來自Bitget的買賣要約。

    買入

    ‌交易

    理財

    ATH
    TWD
    1 ATH = 1.1 TWD
    在所有主流交易平台中,Bitget 提供最低的交易手續費。VIP 等級越高,費率越優惠。

    Bitget 觀點

    MAbbas786
    MAbbas786
    1小時前
    PARTI to USD Chart Particle Network (PARTI) is worth $0.3175 today,
    PARTI to USD Chart Particle Network (PARTI) is worth $0.3175 today, which is a 4.2% decline from an hour ago and a 14.2% decline since yesterday. The value of PARTI today is 0.0% lower compared to its value 7 days ago. In the last 24 hours, the total volume of Particle Network traded was $359,564,537. 7-day price history of Particle Network (PARTI) to USD The daily exchange rate of Particle Network (PARTI) to USD fluctuated between a high of $0.342794 on Thursday and a low of $0.317542 on Friday in the last 7 days. Within the week, the price of PARTI in USD had the largest 24-hour price movement on Friday (0 days ago) by -$0.052609 (14.2%). Compare the daily prices of Particle Network (PARTI) in USD and their 24-hour price movements for the week. Today it reached a high of $0.370176, and now sits at $0.314448. Particle Network (PARTI) price is down 15.06% in the last 24 hours. Particle Network is currently trading on 29 exchanges, with a 24hr trade volume of $382,053,501. Particle Network price today is $ 0.316008 with a 24-hour trading volume of $ 829.43M, market cap of $ 73.63M, and market dominance of 0.00%. The PARTI price decreased -14.38% in the last 24 hours. Particle Network reached its highest price on Mar 25, 2025 when it was trading at its all-time high of $ 1.95981, while Particle Network's lowest price was recorded on Mar 25, 2025 when it was trading at its all-time low of $ 0.306472. The lowest price since it's ATH was $ 0.306472 (cycle low). The highest PARTI price since the last cycle low was $ 0.398885 (cycle high). The Particle Network price prediction sentiment is currently bullish $PARTI
    PARTI-7.19%
    ATH-6.37%
    Smith001
    Smith001
    4小時前
    Reflecting on Partisia Blockchain's (MPC) Recent Trading Performance
    Analyzing the recent trading performance of Partisia Blockchain (MPC) is crucial for understanding its market behavior, price trends, and potential future movements. A deep dive into historical price action, volatility, trading volume, and major price movements helps traders and investors make informed decisions. This article will explore MPC’s historical price movements, major highs and lows, trading volume trends, and what they mean for its future performance. 1. Understanding MPC’s Market Position Partisia Blockchain (MPC) is a privacy-focused blockchain designed to enable secure multi-party computation (MPC) solutions for Web3 applications. As a relatively new project in the cryptocurrency space, its price performance depends on: Adoption rate and real-world use cases. Market sentiment and overall crypto trends. Liquidity and trading volume on exchanges like Bitget. The volatility and trading behavior of MPC can provide valuable insights into whether it is gaining or losing momentum in the market. 2. Historical Price Movements: Key Highs & Lows a. All-Time High and Recent Peak Performance All-Time High (ATH): $0.6933 (March 19, 2024) Significance: This peak was driven by increased investor interest, strong community engagement, and potential bullish sentiment in the broader crypto market. b. All-Time Low and Recent Dips All-Time Low (ATL): $0.02878 (March 20, 2025) Significance: The drop suggests significant bearish pressure, which could be due to factors like profit-taking, lower market liquidity, or negative sentiment. Key Takeaway: MPC’s high volatility suggests that traders should closely watch support and resistance levels. The sharp drop after the ATH indicates potential selling pressure or external market factors influencing price. 3. Trading Volume Trends: Liquidity and Market Interest Trading volume is a key metric that shows how actively an asset is being traded. High trading volume indicates strong market interest, while low volume suggests reduced demand or low liquidity. a. High Trading Volume Periods March 2024: MPC’s trading volume peaked when it hit its all-time high, indicating strong investor interest. Market Impact: High volume often signals price strength and potential for further upward movement. b. Low Trading Volume Periods March 2025: Trading volume declined as the price dropped, suggesting a loss of interest or confidence in the token. Market Impact: Low volume often leads to increased price volatility due to lower liquidity. Key Takeaway: High trading volume + price increase = bullish momentum. Low trading volume + price drop = bearish sentiment or lack of demand. 4. Volatility Analysis: How Stable is MPC? a. Price Swings & Market Reactions MPC has shown significant price swings, moving from its ATH of $0.6933 to its ATL of $0.02878 within a year. Such volatility indicates: Strong speculative interest: Traders are actively moving in and out of positions. Lack of stable accumulation: If a coin’s price fluctuates wildly without sustained growth, it suggests uncertainty in its long-term value. b. Factors Contributing to MPC’s Volatility 1. Market Sentiment: Crypto trends and investor emotions play a huge role in MPC’s price action. 2. Exchange Listings: The availability of MPC on multiple exchanges impacts liquidity and volatility. 3. Whale Activity: Large investors (whales) buying or selling in bulk can cause sudden price spikes or drops. Key Takeaway: High volatility = high risk, high reward – ideal for traders but risky for long-term investors. Stabilizing price = long-term adoption – if MPC stabilizes, it could attract more serious investors. 5. Recent Trading Performance: Bullish or Bearish? a. Short-Term Trends (2025) Price Recovery: If MPC breaks above key resistance levels (e.g., $0.10), it could enter a bullish phase. Bearish Signs: If the price continues to drop below $0.03, it may signal ongoing bearish sentiment. b. Long-Term Trends (Beyond 2025) Adoption & Development: The success of Partisia Blockchain’s technology could lead to price stability and long-term growth. Market Cycles: If Bitcoin and major altcoins enter a bull run, MPC may follow. Key Takeaway: Short-term traders: Watch for resistance levels and volume spikes for possible breakouts. Long-term investors: Focus on project development and adoption to assess future potential. 🆑 Conclusion: What’s Next for MPC? Summary of Recent Trading Performance Final Thoughts Bullish Case: If demand increases and trading volume picks up, MPC could regain its bullish momentum. Bearish Case: If selling pressure continues and demand remains weak, MPC may struggle to recover. Neutral Case: If MPC consolidates in a stable price range, it could be preparing for a breakout. Final Recommendations Traders: Look for strong volume spikes and trend reversals to identify profitable entry points. Investors: Keep an eye on fundamental developments (partnerships, adoption, and token utility). Risk Management: Due to its volatility, use stop-loss strategies to minimize risks in case of unexpected price drops. $PARTI
    BITCOIN-5.33%
    MAJOR-5.26%
    TradingHeights
    TradingHeights
    10小時前
    📊 Weekly RSI Watch – Decision Time! ✅ RSI holding 44 = still bullish ⚠️ Break below = bearish warning 🚫 Break above 79 = invalidates bearish divergence 🚨 New #ATH without breaking 70 = hard crash setup ❤️ Like if you're watching these areas 🔁 Share to alert the Herd $BTC
    BTC-2.42%
    ATH-6.37%
    Cointribune EN
    Cointribune EN
    22小時前
    BTC Has 75 % Shot At New ATH, Says Analyst
    Predictions shape the crypto market, especially when they come from seasoned analysts. As Bitcoin surpasses $85,000, attention turns to its outlook. One statement stands out: Timothy Peterson estimates a 75 % probability that BTC will reach a new ATH by the end of the year. His analysis is based on historical network data, far from risky speculation. As the halving approaches, this forecast fuels debates and could well influence investor decisions. In a post published on March 24 on the social network X (formerly Twitter), Timothy Peterson, an economist specializing in the analysis of the Bitcoin network , claims that BTC has “a 75 % chance of reaching a new all-time high in the next nine months.” This projection relies on a ten-year study of Bitcoin price data, analyzed from a seasonal perspective. Thus, he specifies that BTC is currently operating “near the lower bound of its historical range”, which would statistically strengthen the probabilities of a rebound. He also points out that “Bitcoin has a one in two chance of gaining more than 50 % in the short term”, indicating a favorable setup for a bullish acceleration in the coming months. This analysis by Peterson is based on several key observations from his seasonal model: The approach developed by Timothy Peterson aims to be objective, grounded in tangible historical data rather than short-term market signals. It informs about a potential cyclical dynamic of Bitcoin and implicitly reminds that even a high probability is not a certainty. Beyond statistical models, other indicators enrich market analysis. According to Crazzyblockk, an analyst at CryptoQuant, the price range between $84,000 and $85,000 currently constitutes a critical threshold for institutional investors and whales . He indicates on March 25 that “the realized price for short-term whales is $91,000”, but most heavily active addresses have an average cost basis in this lower range. This price level thus acts as a strategic support zone: a drop below could encourage selling and lead to a marked correction. CryptoQuant data further confirms favorable seasonal trends for Bitcoin. Indeed, the months of April and October record the best annual performances for BTC. This time factor, combined with well-identified technical thresholds, presents a fertile ground for a bullish progression, particularly if demand remains strong in the context of the imminent halving. In sum, these analyses reveal a conjunction of favorable signals, both technical and behavioral. If Bitcoin were to sustainably exceed $90,000, the probabilities of a new ATH could quickly strengthen. Conversely, a drop below this critical threshold could trigger defensive volatility .
    BTC-2.42%
    NEAR-7.43%
    Front Runners_
    Front Runners_
    1天前
    In 2025, Sonic has hit a new ATH in TVL every month. TVL is now approaching $1B, with $7.3B in cumulative DEX volume.
    SONIC-6.98%
    ATH-6.37%

    相關資產

    熱門加密貨幣
    按市值計算的8大加密貨幣。
    相近市值
    在所有 Bitget 資產中,這8種資產的市值最接近 Aethir。