Bitget: Top 4 in global daily trading volume!
Please also display BTC in AR62.58%
New listings on Bitget : Pi Network
BTC/USDT$76710.89 (-3.61%)Fear at Greed Index24(Extreme fear)
Altcoin season index:0(Bitcoin season)
Coins listed in Pre-MarketBABY,PAWS,WCTTotal spot Bitcoin ETF netflow -$103.9M (1D); -$362.1M (7D).Welcome gift package para sa mga bagong user na nagkakahalaga ng 6200 USDT.Claim now
Trade anumang oras, kahit saan gamit ang Bitget app. I-download ngayon

May kaugnayan sa coin
Price calculator
Kasaysayan ng presyo
Paghula ng presyo
Teknikal na pagsusuri
Gabay sa pagbili ng coin
kategorya ng Crypto
Profit calculator


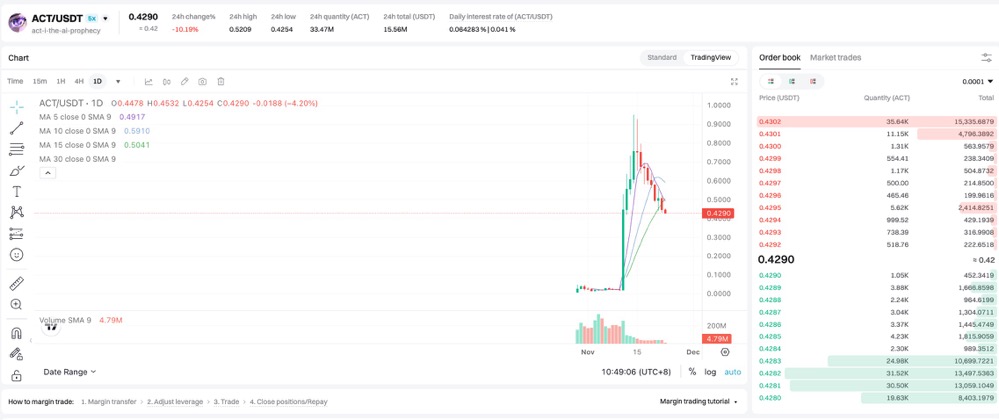
Acet presyoACT
Hindi naka-list
Quote pera:
PHP
Kinukuha ang data mula sa mga third-party na provider. Ang pahinang ito at ang impormasyong ibinigay ay hindi nag-eendorso ng anumang partikular na cryptocurrency. Gustong i-trade ang mga nakalistang barya? Click here
₱3.73-3.05%1D
Price chart
Last updated as of 2025-04-08 22:14:18(UTC+0)
Market cap:₱4,689,102,591.99
Ganap na diluted market cap:₱4,689,102,591.99
Volume (24h):₱16,278,845.81
24h volume / market cap:0.34%
24h high:₱3.93
24h low:₱3.7
All-time high:₱111.16
All-time low:₱0.1230
Umiikot na Supply:1,258,035,100 ACT
Total supply:
2,230,764,830.37ACT
Rate ng sirkulasyon:56.00%
Max supply:
--ACT
Price in BTC:0.{6}8461 BTC
Price in ETH:0.{4}4425 ETH
Price at BTC market cap:
₱69,505.42
Price at ETH market cap:
₱8,080.12
Mga kontrata:
0x9f3b...86ac31d(BNB Smart Chain (BEP20))
Higit pa
Ano ang nararamdaman mo tungkol sa Acet ngayon?
Tandaan: Ang impormasyong ito ay para sa sanggunian lamang.
Presyo ng Acet ngayon
Ang live na presyo ng Acet ay ₱3.73 bawat (ACT / PHP) ngayon na may kasalukuyang market cap na ₱4.69B PHP. Ang 24 na oras na dami ng trading ay ₱16.28M PHP. Ang presyong ACT hanggang PHP ay ina-update sa real time. Ang Acet ay -3.05% sa nakalipas na 24 na oras. Mayroon itong umiikot na supply ng 1,258,035,100 .
Ano ang pinakamataas na presyo ng ACT?
Ang ACT ay may all-time high (ATH) na ₱111.16, na naitala noong 2021-11-03.
Ano ang pinakamababang presyo ng ACT?
Ang ACT ay may all-time low (ATL) na ₱0.1230, na naitala noong 2024-07-09.
Bitcoin price prediction
Kailan magandang oras para bumili ng ACT? Dapat ba akong bumili o magbenta ng ACT ngayon?
Kapag nagpapasya kung buy o mag sell ng ACT, kailangan mo munang isaalang-alang ang iyong sariling diskarte sa pag-trading. Magiiba din ang aktibidad ng pangangalakal ng mga long-term traders at short-term traders. Ang Bitget ACT teknikal na pagsusuri ay maaaring magbigay sa iyo ng sanggunian para sa trading.
Ayon sa ACT 4 na teknikal na pagsusuri, ang signal ng kalakalan ay Malakas na nagbebenta.
Ayon sa ACT 1d teknikal na pagsusuri, ang signal ng kalakalan ay Sell.
Ayon sa ACT 1w teknikal na pagsusuri, ang signal ng kalakalan ay Buy.
Ano ang magiging presyo ng ACT sa 2026?
Batay sa makasaysayang modelo ng hula sa pagganap ng presyo ni ACT, ang presyo ng ACT ay inaasahang aabot sa ₱3.7 sa 2026.
Ano ang magiging presyo ng ACT sa 2031?
Sa 2031, ang presyo ng ACT ay inaasahang tataas ng +2.00%. Sa pagtatapos ng 2031, ang presyo ng ACT ay inaasahang aabot sa ₱9.98, na may pinagsama-samang ROI na +155.52%.
Acet price history (PHP)
The price of Acet is +124.48% over the last year. The highest price of in PHP in the last year was ₱51.48 and the lowest price of in PHP in the last year was ₱0.1230.
TimePrice change (%) Lowest priceHighest price
Lowest priceHighest price 24h-3.05%₱3.7₱3.93
7d-21.39%₱3.2₱4.69
30d-19.37%₱3.2₱5.74
90d+436.49%₱0.5407₱5.74
1y+124.48%₱0.1230₱51.48
All-time-88.55%₱0.1230(2024-07-09, 274 araw ang nakalipas )₱111.16(2021-11-03, 3 taon na ang nakalipas )
Acet impormasyon sa merkado
Acet's market cap history
Acet holdings by concentration
Whales
Investors
Retail
Acet addresses by time held
Holders
Cruisers
Traders
Live coinInfo.name (12) price chart

Acet na mga rating
Mga average na rating mula sa komunidad
4.6
Ang nilalamang ito ay para sa mga layuning pang-impormasyon lamang.
ACT sa lokal na pera
1 ACT To MXN$1.351 ACT To GTQQ0.51 ACT To CLP$64.881 ACT To UGXSh240.961 ACT To HNLL1.661 ACT To ZARR1.281 ACT To TNDد.ت0.21 ACT To IQDع.د84.931 ACT To TWDNT$2.151 ACT To RSDдин.6.921 ACT To DOP$4.071 ACT To MYRRM0.291 ACT To GEL₾0.181 ACT To UYU$2.731 ACT To MADد.م.0.621 ACT To AZN₼0.111 ACT To OMRر.ع.0.021 ACT To KESSh8.391 ACT To SEKkr0.651 ACT To UAH₴2.66
- 1
- 2
- 3
- 4
- 5
Last updated as of 2025-04-08 22:14:18(UTC+0)
Acet balita

Meta Gorgonite: Bakit ang potensyal ng $ACT ay malayo pa sa katapusan
推特观点精选•2024-11-23 02:50
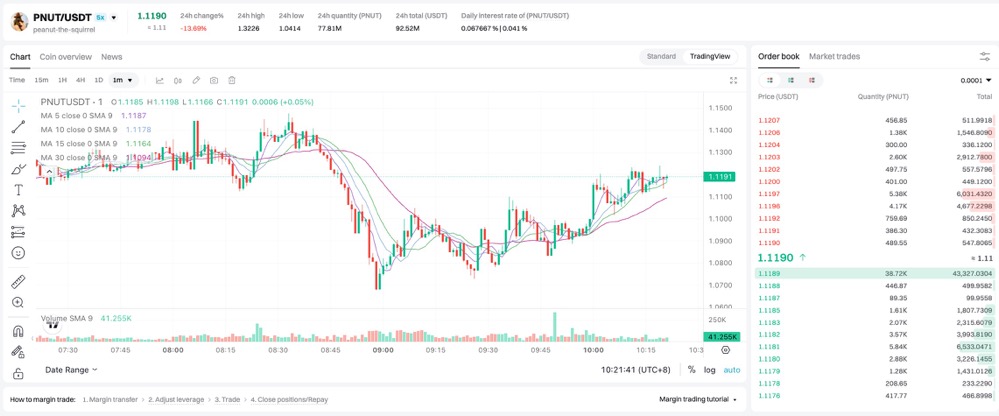
Sun at Moon Xiao Chu: Bakit patuloy akong nagdadagdag ng posisyon sa pag-pullback ng $PNUT at $ACT?
Twitter Opinion Selection•2024-11-23 02:24
![Dapat Basahin Ngayon | Mga Itinatampok na Tanawin sa Twitter [Nobyembre 22]](https://img.bgstatic.com/multiLang/web/8e1199d7822fef00d2ec95133764186d.png)
Dapat Basahin Ngayon | Mga Itinatampok na Tanawin sa Twitter [Nobyembre 22]
Renata•2024-11-22 09:22
Dapat Basahin Ngayon | Mga Itinatampok na Tanawin sa Twitter [Nobyembre 18]
Renata•2024-11-18 07:48
New listings on Bitget
New listings

Buy more


Ang mga tao ay nagtatanong din tungkol sa presyo ng Acet.
Ano ang kasalukuyang presyo ng Acet?
The live price of Acet is ₱3.73 per (ACT/PHP) with a current market cap of ₱4,689,102,591.99 PHP. Acet's value undergoes frequent fluctuations due to the continuous 24/7 activity in the crypto market. Acet's current price in real-time and its historical data is available on Bitget.
Ano ang 24 na oras na dami ng trading ng Acet?
Sa nakalipas na 24 na oras, ang dami ng trading ng Acet ay ₱16.28M.
Ano ang all-time high ng Acet?
Ang all-time high ng Acet ay ₱111.16. Ang pinakamataas na presyong ito sa lahat ng oras ay ang pinakamataas na presyo para sa Acet mula noong inilunsad ito.
Maaari ba akong bumili ng Acet sa Bitget?
Oo, ang Acet ay kasalukuyang magagamit sa sentralisadong palitan ng Bitget. Para sa mas detalyadong mga tagubilin, tingnan ang aming kapaki-pakinabang na gabay na Paano bumili ng .
Maaari ba akong makakuha ng matatag na kita mula sa investing sa Acet?
Siyempre, nagbibigay ang Bitget ng estratehikong platform ng trading, na may mga matatalinong bot sa pangangalakal upang i-automate ang iyong mga pangangalakal at kumita ng kita.
Saan ako makakabili ng Acet na may pinakamababang bayad?
Ikinalulugod naming ipahayag na ang estratehikong platform ng trading ay magagamit na ngayon sa Bitget exchange. Nag-ooffer ang Bitget ng nangunguna sa industriya ng mga trading fee at depth upang matiyak ang kumikitang pamumuhunan para sa mga trader.
Saan ako makakabili ng crypto?
Video section — quick verification, quick trading

How to complete identity verification on Bitget and protect yourself from fraud
1. Log in to your Bitget account.
2. If you're new to Bitget, watch our tutorial on how to create an account.
3. Hover over your profile icon, click on “Unverified”, and hit “Verify”.
4. Choose your issuing country or region and ID type, and follow the instructions.
5. Select “Mobile Verification” or “PC” based on your preference.
6. Enter your details, submit a copy of your ID, and take a selfie.
7. Submit your application, and voila, you've completed identity verification!
Ang mga investment sa Cryptocurrency, kabilang ang pagbili ng Acet online sa pamamagitan ng Bitget, ay napapailalim sa market risk. Nagbibigay ang Bitget ng madali at convenient paraan para makabili ka ng Acet, at sinusubukan namin ang aming makakaya upang ganap na ipaalam sa aming mga user ang tungkol sa bawat cryptocurrency na i-eooffer namin sa exchange. Gayunpaman, hindi kami mananagot para sa mga resulta na maaaring lumabas mula sa iyong pagbili ng Acet. Ang page na ito at anumang impormasyong kasama ay hindi isang pag-endorso ng anumang partikular na cryptocurrency.
Binance ChainBNB Chain Ecosystem
Bitget Insights

Wavvylad
8h
PUMP/USDT Dips Below Support – Will the Bulls Return?
The $PUMP trading pair on Bitget is showing signs of short-term bearish pressure. At the time of the snapshot, the token is trading at $0.03731, down 8.64% in the past 24 hours. The 24-hour high stands at $0.04459, with a low of $0.03730, indicating a significant pullback from recent highs.
Key Technical Observations:
Downtrend Confirmation: The price is trading below all major moving averages:
Volume Spike on Decline: Volume has picked up alongside the downtrend (last visible bar: 236.77K), which often indicates stronger selling momentum.
Support Levels: The recent dip to $0.03590 could act as the next crucial support zone. If it fails to hold, further downside toward $0.032 could follow.
Resistance Levels: Any bounce will face immediate resistance at the MA(5) around $0.0395, followed by the psychological level of $0.040.
Market Prediction:
Short term, $PUMP appears bearish unless it can reclaim the $0.039–$0.040 zone with strong buying volume. If buyers step in and the price closes above MA(10), a relief rally toward $0.042–$0.044 could be expected. Otherwise, a consolidation or further dip toward the $0.033–$0.035 region seems more likely.
Traders should remain cautious and watch for a clear reversal signal before entering long positions. If the market sentiment improves and $PUMP can sustain above its 20 MA, a bullish recovery may be on the horizon. For now, the trend is still downward.
HOLD-10.32%
MAJOR-4.10%

Shemmie007
10h
Crypto's Gambling Paradox: How Buzzwords Mask Bad Bets
The crypto market often mirrors a high-stakes casino, dressed in Silicon Valley lingo. Terms like "protocol," "ecosystem," and "long-term vision" aren't just jargon—they're psychological armor. Investors use them to reframe reckless trades as strategic moves, blurring the line between calculated risk and blind speculation.
Buzzwords act as a smokescreen, transforming emotional decisions into narratives of innovation. A failed trade becomes "contributing to protocol development," while chasing pumps is rebranded as "supporting the ecosystem." This vocabulary doesn't just justify losses; it fosters a culture where admitting mistakes feels like betraying a movement.
Crypto's volatility triggers biases. "I'll HODL because I'm here for the vision" masks refusal to accept loss, a classic sunk cost fallacy.
Newcomers, dazzled by jargon, confuse luck with expertise, falling into FOMO-driven overconfidence that echoes the Dunning-Kruger effect. Loyalty to projects, like "ETH maxi" or "Bitcoin OG," fuels tribalism that discourages critical analysis.
Breaking free starts with asking, "What problem does this solve?" If the answer leans on buzzwords, it's a signal to dig deeper.
Selling isn't failure—setting strict stop-loss limits and sticking to them can protect you. Treating crypto as a slice of your portfolio, not an identity, keeps tribal lines from clouding judgment.
Crypto's potential is real, but so is its capacity to exploit human psychology. Recognizing gambling tendencies isn't cynicism—it's self-defense. As one trader quipped, "In crypto, 'long-term vision' often means 'I need time to gaslight myself into believing this was smart.'" The market won't reward faith alone. Cut through the lexicon, and you might just cut your losses.
ETH-5.80%
BITCOIN-7.91%

Mails
11h
First-ever leveraged XRP ETF set to debut in the US
New ETF offers double the daily return of XRP, adding innovative options for crypto investors.
First-ever leveraged XRP ETF set to debut in the US
Key Takeaways
Teucrium is launching the first leveraged ETF linked to XRP in the US, trading under the ticker XXRP.
The ETF aims to deliver twice the daily return of XRP and has a 1.85% expense ratio.
Teucrium Investment Advisors is set to launch the first-ever leveraged exchange-traded fund linked to XRP, the fourth-largest crypto asset by market cap, Bloomberg reported Monday.
The fund, called the Teucrium 2x Long Daily XRP ETF, will trade on NYSE Arca under the ticker XXRP. The exchange has certified its approval of the listing and registration of the fund.
The ETF aims to offer investors a leveraged way to bet on the daily price movements of XRP. The fund seeks to deliver returns that are double the daily return of $XRP through the use of swap agreements.
The XXRP ETF will charge a management fee of 1.89%, according to its prospectus.
To determine the price of XRP for the swap agreements, the fund will reference several benchmarks, including the CME CF XRP-Dollar Reference Rate, the CME CF XRP-Dollar Real Time Index, and spot XRP ETFs.
However, since there are no US-listed spot XRP ETFs suitable for the fund’s investment or as a reference asset, the XXRP ETF will initially base its XRP swaps on several XRP ETPs listed on European exchanges. These include 21Shares XRP ETP, Bitwise Physical XRP ETP, Virtune XRP ETP, WisdomTree Physical XRP ETP, and CoinShares Physical XRP ETP.
Teucrium Investment Advisors, currently managing $311 million in assets, specializes in providing ETFs focused on alternative investments, such as agricultural commodities and other niche markets.
Prior to the XXRP fund, Teucrium had already launched a Bitcoin futures ETF, called the Teucrium Bitcoin Futures Fund. The product launched in April 2022 after being approved by the SEC under the Securities Act of 1933.
According to its prospectus, Teucrium is also seeking to launch a short version of the Teucrium 2x Long Daily XRP ETF, dubbed the Teucrium 2x Short Daily XRP ETF. The leveraged inverse ETF would allow investors to potentially profit from daily declines in the price of XRP.
According to Sal Gilbertie, founder and CEO of Teucrium ETFs, the decision to launch the leveraged XRP ETF at this time was influenced by attractive low prices.
He also noted that there was considerable investor demand for XRP, which he expects would be heightened by the fund’s leverage.
XRP was trading at $1.9 at press time, up 1% in the last 24 hours, according to CoinGecko.
The launch comes as the years-long legal battle between the SEC and Ripple Labs, the company behind XRP, approaches the final line, as confirmed by Ripple CEO Brad Garlinghouse last month.
Garlinghouse, speaking in a recent interview with Bloomberg, said that he anticipates the launch of multiple XRP ETFs in the US during the second half of 2025.
The favorable settlement with the SEC immediately boosted market optimism, pushing the odds of XRP ETF approval to 86% and increasing XRP’s value by 14%.
In the US, several asset managers—including Bitwise, Canary Capital, 21Shares, WisdomTree, CoinShares, Grayscale, and Franklin Templeton—have already submitted filings to the SEC for their own XRP ETFs.
ProShares and Volatility Shares are also seeking a regulatory nod for XRP-linked investment products.
According to Nate Geraci, President of The ETF Store, the outcome of the suit could prompt major players like BlackRock and Fidelity to consider joining the XRP ETF race.
X-9.23%
ARCA+1.47%

INVESTERCLUB
14h
SEC approves first ever XRP ETF:
SEC approves first ever XRP ETF:
- The SEC approved Teucrium’s launch of the first leveraged XRP ETF in the U.S.
- The ETF is structured under the Securities Act of 1933 and uses swap agreements, not direct XRP holdings.
- It uses pricing benchmarks from CME CF XRP rates and European ETPs due to the lack of a U.S. spot XRP ETF.$XRP
XRP-4.98%
S-8.41%

Nusrat_Mim_CryptoQue
16h
$SOL
SOLUSDT Market Analysis | 1H Chart Update & Multi-Timeframe Outlook
Current Price: $109.76
24H Change: +7.64%
24H High/Low: $112.99 / $95.23
Volume (24H): 7.97M SOL
Market Snapshot:
After a sharp correction that pulled SOL down to the $95.23 support zone, we’re seeing a strong bounce and continuation to the upside. Currently, SOL is retesting the $110 zone, which acts as both a psychological and technical resistance.
Technical Breakdown (1H Chart):
EMA Analysis:
SOL is trading above the 5, 10, and 20 EMAs, indicating short-term bullish momentum. The EMA(10) and EMA(20) recently crossed, confirming the upside trend continuation.
Parabolic SAR:
Dots are below the price action — a bullish sign confirming upward pressure.
MACD:
MACD line is above the signal line with increasing histogram bars — momentum is picking up.
KDJ Oscillator:
K line is above D and J, suggesting strong buying strength but nearing overbought territory — short-term consolidation may occur.
Volume Surge:
A noticeable increase in volume suggests growing interest and potentially institutional activity near the dip.
Multi-Timeframe Prediction:
1. Short-Term (1H-4H):
If SOL holds above $108 and breaks $112.98, we may see a move toward $116-$119 as the next resistance. RSI and MACD support this potential breakout.
2. Mid-Term (1D):
Watch for a close above the 50-day moving average (not shown here but relevant). If bullish momentum continues, $125-$130 becomes a feasible mid-range target.
3. Long-Term Outlook (1W):
As macro sentiment improves and BTC remains stable, SOL could aim for $150+ in a sustained bullish run, though corrections should be expected along the way.
Personal Insights:
Solana’s recent rebound from $95 is not just a technical bounce — it reflects confidence returning after a strong sell-off. Smart traders are likely to watch for confirmation above $112 with increased volume. Caution is still warranted if SOL dips back below $105.
Final Thought:
This recovery looks promising, but always adapt your strategy to real-time data. Multi-timeframe analysis helps reduce noise and improves decision-making. Let’s keep an eye on key levels and stay ready to act.
BTC-3.15%
MOVE-5.53%
Mga kaugnay na asset
Mga sikat na cryptocurrencies
Isang seleksyon ng nangungunang 8 cryptocurrencies ayon sa market cap.


Kamakailang idinagdag
Ang pinakahuling idinagdag na cryptocurrency.