Bitget: Top 4 in global daily trading volume!
Please also display BTC in AR59.75%
New listings on Bitget:Pi Network
Altcoin season index:0(Bitcoin season)
BTC/USDT$95820.16 (-0.95%)Fear at Greed Index50(Neutral)
Total spot Bitcoin ETF netflow -$50.4M (1D); -$626.2M (7D).Welcome gift package para sa mga bagong user na nagkakahalaga ng 6200 USDT.Claim now
Trade anumang oras, kahit saan gamit ang Bitget app. I-download ngayon

May kaugnayan sa coin
Price calculator
Kasaysayan ng presyo
Paghula ng presyo
Teknikal na pagsusuri
Gabay sa pagbili ng coin
kategorya ng Crypto
Profit calculator
Kaugnay ng trade
Bili/benta
Magdeposito/Mag-withdraw
Spot
Margin
USDT-M futures
Coin-M futures
Mga bot sa trading
Kopyahin ang trading
Kumita
Pre-market


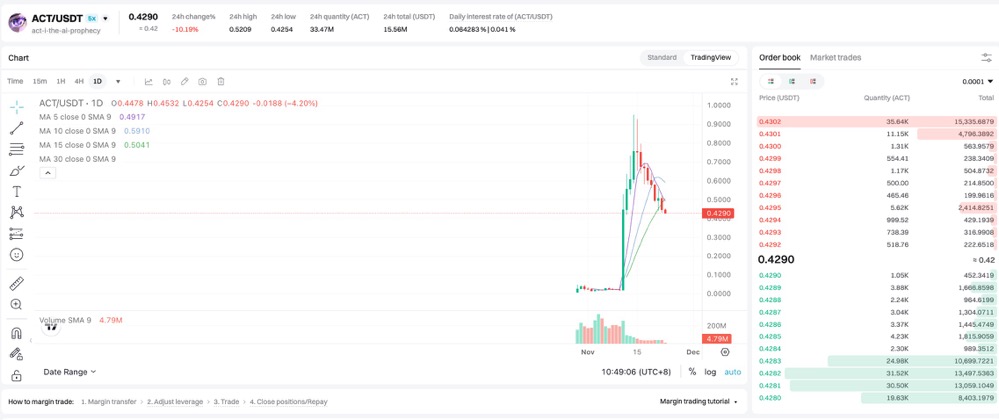
Act I : The AI Prophecy presyoACT
Listed
BumiliQuote pera:
USD
$0.1894-6.81%1D
Price chart
TradingView
Last updated as of 2025-02-23 18:25:02(UTC+0)
Market cap:$179,584,107.69
Ganap na diluted market cap:$179,584,107.69
Volume (24h):$78,721,823.19
24h volume / market cap:43.83%
24h high:$0.2063
24h low:$0.1874
All-time high:$0.9420
All-time low:$0.0001448
Umiikot na Supply:948,245,760 ACT
Total supply:
948,245,766.54ACT
Rate ng sirkulasyon:99.00%
Max supply:
--ACT
Price in BTC:0.{5}1978 BTC
Price in ETH:0.{4}6720 ETH
Price at BTC market cap:
$2,001.67
Price at ETH market cap:
$358.35
Mga kontrata:
GJAFwW...gUnpump(Solana)
Higit pa
Ano ang nararamdaman mo tungkol sa Act I : The AI Prophecy ngayon?
Tandaan: Ang impormasyong ito ay para sa sanggunian lamang.
Presyo ng Act I : The AI Prophecy ngayon
Ang live na presyo ng Act I : The AI Prophecy ay $0.1894 bawat (ACT / USD) ngayon na may kasalukuyang market cap na $179.58M USD. Ang 24 na oras na dami ng trading ay $78.72M USD. Ang presyong ACT hanggang USD ay ina-update sa real time. Ang Act I : The AI Prophecy ay -6.81% sa nakalipas na 24 na oras. Mayroon itong umiikot na supply ng 948,245,760 .
Ano ang pinakamataas na presyo ng ACT?
Ang ACT ay may all-time high (ATH) na $0.9420, na naitala noong 2024-11-14.
Ano ang pinakamababang presyo ng ACT?
Ang ACT ay may all-time low (ATL) na $0.0001448, na naitala noong 2024-10-19.
Bitcoin price prediction
Ano ang magiging presyo ng ACT sa 2026?
Batay sa makasaysayang modelo ng hula sa pagganap ng presyo ni ACT, ang presyo ng ACT ay inaasahang aabot sa $0.2084 sa 2026.
Ano ang magiging presyo ng ACT sa 2031?
Sa 2031, ang presyo ng ACT ay inaasahang tataas ng 0.00%. Sa pagtatapos ng 2031, ang presyo ng ACT ay inaasahang aabot sa $0.2481, na may pinagsama-samang ROI na +23.22%.
Act I : The AI Prophecy price history (USD)
The price of Act I : The AI Prophecy is +608.68% over the last year. The highest price of ACT in USD in the last year was $0.9420 and the lowest price of ACT in USD in the last year was $0.0001448.
TimePrice change (%) Lowest priceHighest price
Lowest priceHighest price 24h-6.81%$0.1874$0.2063
7d+3.66%$0.1794$0.2097
30d-2.77%$0.1458$0.2567
90d-56.36%$0.1458$0.8024
1y+608.68%$0.0001448$0.9420
All-time+534.76%$0.0001448(2024-10-19, 128 araw ang nakalipas )$0.9420(2024-11-14, 102 araw ang nakalipas )
Act I : The AI Prophecy impormasyon sa merkado
Act I : The AI Prophecy's market cap history
Act I : The AI Prophecy market
Act I : The AI Prophecy holdings by concentration
Whales
Investors
Retail
Act I : The AI Prophecy addresses by time held
Holders
Cruisers
Traders
Live coinInfo.name (12) price chart

Act I : The AI Prophecy na mga rating
Mga average na rating mula sa komunidad
4.3
Ang nilalamang ito ay para sa mga layuning pang-impormasyon lamang.
ACT sa lokal na pera
1 ACT To MXN$3.871 ACT To GTQQ1.461 ACT To CLP$178.81 ACT To UGXSh695.611 ACT To HNLL4.841 ACT To ZARR3.481 ACT To TNDد.ت0.61 ACT To IQDع.د248.191 ACT To TWDNT$6.211 ACT To RSDдин.21.211 ACT To DOP$11.81 ACT To MYRRM0.841 ACT To GEL₾0.531 ACT To UYU$8.171 ACT To MADد.م.1.891 ACT To OMRر.ع.0.071 ACT To AZN₼0.321 ACT To KESSh24.541 ACT To SEKkr2.021 ACT To UAH₴7.88
- 1
- 2
- 3
- 4
- 5
Last updated as of 2025-02-23 18:25:02(UTC+0)
Paano Bumili ng Act I : The AI Prophecy(ACT)

Lumikha ng Iyong Libreng Bitget Account
Mag-sign up sa Bitget gamit ang iyong email address/mobile phone number at gumawa ng malakas na password para ma-secure ang iyong account.

Beripikahin ang iyong account
I-verify ang iyong pagkakakilanlan sa pamamagitan ng paglalagay ng iyong personal na impormasyon at pag-upload ng wastong photo ID.

Bumili ng Act I : The AI Prophecy (ACT)
Gumamit ng iba't ibang mga pagpipilian sa pagbabayad upang bumili ng Act I : The AI Prophecy sa Bitget. Ipapakita namin sa iyo kung paano.
I-trade ang ACT panghabang-buhay na hinaharap
Pagkatapos ng matagumpay na pag-sign up sa Bitget at bumili ng USDT o ACT na mga token, maaari kang magsimulang mag-trading ng mga derivatives, kabilang ang ACT futures at margin trading upang madagdagan ang iyong inccome.
Ang kasalukuyang presyo ng ACT ay $0.1894, na may 24h na pagbabago sa presyo ng -6.81%. Maaaring kumita ang mga trader sa pamamagitan ng alinman sa pagtagal o pagkukulang saACT futures.
Sumali sa ACT copy trading sa pamamagitan ng pagsunod sa mga elite na traders.
Pagkatapos mag-sign up sa Bitget at matagumpay na bumili ng mga token ng USDT o ACT, maaari ka ring magsimula ng copy trading sa pamamagitan ng pagsunod sa mga elite na traders.
Act I : The AI Prophecy balita

Meta Gorgonite: Bakit ang potensyal ng $ACT ay malayo pa sa katapusan
推特观点精选•2024-11-23 02:50
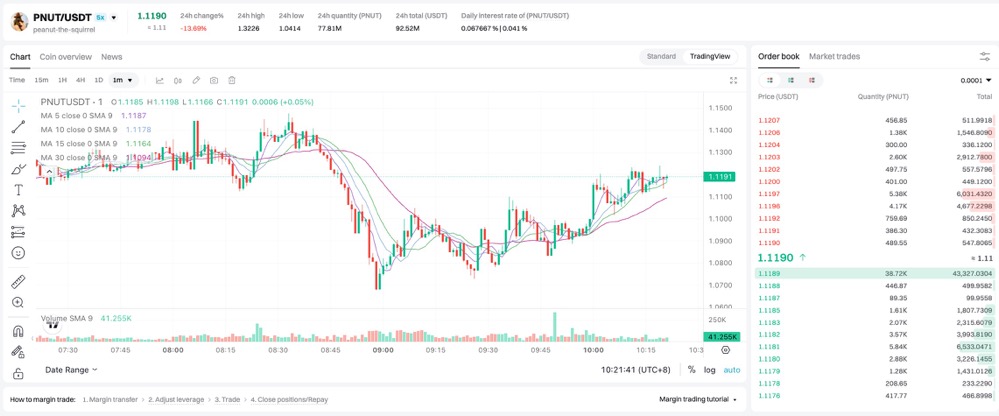
Sun at Moon Xiao Chu: Bakit patuloy akong nagdadagdag ng posisyon sa pag-pullback ng $PNUT at $ACT?
Twitter Opinion Selection•2024-11-23 02:24
![Dapat Basahin Ngayon | Mga Itinatampok na Tanawin sa Twitter [Nobyembre 22]](https://img.bgstatic.com/multiLang/web/8e1199d7822fef00d2ec95133764186d.png)
Dapat Basahin Ngayon | Mga Itinatampok na Tanawin sa Twitter [Nobyembre 22]
Renata•2024-11-22 09:22
Dapat Basahin Ngayon | Mga Itinatampok na Tanawin sa Twitter [Nobyembre 18]
Renata•2024-11-18 07:48

Buy more


Ang mga tao ay nagtatanong din tungkol sa presyo ng Act I : The AI Prophecy.
Ano ang kasalukuyang presyo ng Act I : The AI Prophecy?
The live price of Act I : The AI Prophecy is $0.19 per (ACT/USD) with a current market cap of $179,584,107.69 USD. Act I : The AI Prophecy's value undergoes frequent fluctuations due to the continuous 24/7 activity in the crypto market. Act I : The AI Prophecy's current price in real-time and its historical data is available on Bitget.
Ano ang 24 na oras na dami ng trading ng Act I : The AI Prophecy?
Sa nakalipas na 24 na oras, ang dami ng trading ng Act I : The AI Prophecy ay $78.72M.
Ano ang all-time high ng Act I : The AI Prophecy?
Ang all-time high ng Act I : The AI Prophecy ay $0.9420. Ang pinakamataas na presyong ito sa lahat ng oras ay ang pinakamataas na presyo para sa Act I : The AI Prophecy mula noong inilunsad ito.
Maaari ba akong bumili ng Act I : The AI Prophecy sa Bitget?
Oo, ang Act I : The AI Prophecy ay kasalukuyang magagamit sa sentralisadong palitan ng Bitget. Para sa mas detalyadong mga tagubilin, tingnan ang aming kapaki-pakinabang na gabay na Paano bumili ng .
Maaari ba akong makakuha ng matatag na kita mula sa investing sa Act I : The AI Prophecy?
Siyempre, nagbibigay ang Bitget ng estratehikong platform ng trading, na may mga matatalinong bot sa pangangalakal upang i-automate ang iyong mga pangangalakal at kumita ng kita.
Saan ako makakabili ng Act I : The AI Prophecy na may pinakamababang bayad?
Ikinalulugod naming ipahayag na ang estratehikong platform ng trading ay magagamit na ngayon sa Bitget exchange. Nag-ooffer ang Bitget ng nangunguna sa industriya ng mga trading fee at depth upang matiyak ang kumikitang pamumuhunan para sa mga trader.
Saan ako makakabili ng Act I : The AI Prophecy (ACT)?
Video section — quick verification, quick trading

How to complete identity verification on Bitget and protect yourself from fraud
1. Log in to your Bitget account.
2. If you're new to Bitget, watch our tutorial on how to create an account.
3. Hover over your profile icon, click on “Unverified”, and hit “Verify”.
4. Choose your issuing country or region and ID type, and follow the instructions.
5. Select “Mobile Verification” or “PC” based on your preference.
6. Enter your details, submit a copy of your ID, and take a selfie.
7. Submit your application, and voila, you've completed identity verification!
Ang mga investment sa Cryptocurrency, kabilang ang pagbili ng Act I : The AI Prophecy online sa pamamagitan ng Bitget, ay napapailalim sa market risk. Nagbibigay ang Bitget ng madali at convenient paraan para makabili ka ng Act I : The AI Prophecy, at sinusubukan namin ang aming makakaya upang ganap na ipaalam sa aming mga user ang tungkol sa bawat cryptocurrency na i-eooffer namin sa exchange. Gayunpaman, hindi kami mananagot para sa mga resulta na maaaring lumabas mula sa iyong pagbili ng Act I : The AI Prophecy. Ang page na ito at anumang impormasyong kasama ay hindi isang pag-endorso ng anumang partikular na cryptocurrency.
Bitget Insights
Hustler🥰
4h
Introduction In the dynamic realm of cryptocurrencies, every chart tells a story. The recent price a
Introduction In the dynamic realm of cryptocurrencies, every chart tells a story. The recent price action of the ONDO/USDT pair has been a narrative of highs, lows, and sideways battles. This article delves into the technical dimensions of that journey, highlighting key turning points and levels that may shape future movements.
A Tale of Highs and Lows
The chart paints a picture of a token that once reached a notable peak—likely reflecting bullish sentiment or a market rally—only to be met with a subsequent downturn. This decline from the earlier high suggests that market participants quickly reassessed the asset’s value, possibly reacting to broader trends or specific developments related to ONDO. In technical analysis, such reversals can signal a period of consolidation or even a transition toward a new trend.
The Dance of Consolidation and Rallies
Amid the downtrend, the chart reveals episodes of sideways movement. These periods of consolidation indicate moments when buyers and sellers were in a delicate balance. Temporary rallies punctuated these intervals, hinting that some market participants viewed the dip as a buying opportunity. However, these upward spurts were met with resistance, which ultimately reined in the price. Traders watching for a breakout would likely consider these rallies as early indicators of potential shifts in momentum.
Critical Support and Resistance Levels
Key technical markers emerge when identifying the support and resistance zones on the chart. The support area—positioned around the lower price range—appears to act as a safety net where buyers step in, preventing further declines. Conversely, resistance near the mid-price range has repeatedly halted upward advances, suggesting that overcoming this barrier could be essential for any sustained bullish move. These levels are not just numbers; they reflect collective market psychology and trading history.
Looking Forward
For technical traders, the ONDO/USDT chart is a call to monitor the balance between support and resistance closely. A decisive move beyond these established levels may indicate a change in market sentiment—either a bullish breakout or a bearish continuation. As always, while historical patterns offer clues, the inherent volatility of the crypto market reminds us that caution and further analysis are paramount.
Disclaimer: The insights provided in this article are for informational purposes only and should not be taken as financial advice. Always perform your own analysis or consult with a financial expert before making any investment decisions.
$ONDO
MOVE-2.26%
ONDO-2.54%

Ravikash Gupta
4h
Crypto Titans Tested: BitLemons Vs. Cardano Vs. Polkadot
Disclosure: This article does not represent investment advice. The content and materials featured on this page are for educational purposes only.
As crypto volatility rises, investors eye opportunities in Bitcoin, BitLemons, Cardano, and Polkadot.
As the crypto market navigates through heightened volatility, savvy investors are turning their attention to three distinct opportunities. While Bitcoin hovers near its recent ATH, emerging platforms like BitLemons (BLEM) are positioning themselves alongside established players Cardano (ADA) and Polkadot (DOT) as potential portfolio cornerstones.
You might also like: BTC nears $100k, SOL eyes $200; BitLemons targets huge gains
Is BitLemons redefining the GambleFi landscape?
In a sector ripe for disruption, BitLemons has emerged as a formidable contender in the $450b traditional casino market. This isn’t just another gaming token – it’s a fully operational crypto casino boasting over 8,000 games from industry giants like Evolution and Pragmatic. The platform’s 24/7 revenue generation model has caught the attention of serious investors, particularly after securing $1 million in private seed funding.
What sets BitLemons apart is its transformative tokenomics structure. An impressive 30% of Gross Gaming Revenue (GGR) is dedicated to token mechanics, split evenly between buyback & burn programs and staking rewards. This deflationary approach, coupled with dual security audits from SpyWolf and SolidProof, positions BLEM as one of the most robust offerings in the space.
The presale momentum is undeniable – Stage 1 sold out in just 16 days, and Stage 2 is moving rapidly at $0.02 per token. With rumors of a 17-18c listing price, early investors are racing to secure positions before the next price increment.
How is Cardano transforming after the Plomin fork?
The recent Plomin hard fork has injected new life into Cardano‘s ecosystem. Looking at the charts, ADA has shown remarkable resilience, maintaining a strong position at $0.8013 despite a slight 1.24% weekly dip. The 24-hour trading volume has surged to $664.25m, indicating growing market interest.
Technical analysis reveals an encouraging upward trend following the mid-February consolidation, with strong support established around the $0.74 level. The positive market sentiment is reflected in the 1.89% increase in market cap, now standing at $28.21b.
Can Polkadot’s ETF filing change its trajectory?
Polkadot’s recent headlines regarding Tuttle Capital’s leveraged ETF filing have sparked renewed interest in DOT. Despite a 2.88% weekly decline, DOT maintains a robust $5.08 price point, supported by a healthy daily trading volume of $187.29m.
The technical indicators show DOT building momentum, with its market cap climbing 2.29% to $7.88b. The charts suggest a potential breakout forming, particularly if the ETF developments proceed favorably.
Why BitLemons is poised for an unstoppable rally
While established players like ADA and DOT continue their evolutionary paths, BitLemons presents a unique value proposition in the GambleFi sector. Its combination of immediate utility, transparent revenue sharing, and deflationary mechanics offers a compelling investment case that few projects can match.
The time to act is now – with Stage 2 of the presale in full swing and the price set to increase soon, early investors have a rare opportunity to position themselves ahead of the curve.
For more information, visit the official website and socials.
Read more: BitLemons could challenge TRX and SHIB, here’s why
Disclosure: This content is provided by a third party. crypto.news does not endorse any product mentioned on this page. Users must do their own research before taking any actions related to the company.
WHY-7.41%
BTC-0.75%
Ravikash Gupta
4h
Building the Next-gen Creator Economy With AI Agents | Opinion
Disclosure: The views and opinions expressed here belong solely to the author and do not represent the views and opinions of crypto.news’ editorial.
The creator economy has seen explosive growth over the past decade, yet many content creators, writers, educators, and artists face a fundamental dilemma: monetization and content distribution often favor centralized platforms, which impose rigid rules, fees, and algorithms that limit creators’ autonomy and earnings.
You might also like: Creator economy 2.0: AI and web3 define the digital success | Opinion
While web3 solutions promise greater freedom, they have thus far often had poor user experiences and required creators to navigate complex onboarding processes and applications. However, blockchain-based autonomous agents are emerging as a new alternative for creators, seamlessly handling tasks, sparking new creative possibilities, and finally putting creators back in control of their work and income.
Creator assistants
Autonomous agents simplify content distribution and monetization by automating tasks such as pricing, licensing, and revenue sharing, freeing creators to focus on their craft. For instance, these agents can optimize pricing strategies based on market demand or manage revenue splits transparently. Unlike traditional AI tools, decentralized agents can operate trustlessly onchain, ensuring transparency, reducing costs, and eliminating third-party intermediaries.
By leveraging programmable rules and onchain verification, autonomous agents also allow creators to explore new revenue streams—such as micro-licensing or fractional ownership of digital assets—giving them control over their intellectual property while tapping into innovative monetization models. Ethical concerns, such as licensing and copyright issues, can be addressed through programmable licensing rights embedded in content metadata.
Art curator agents
In the digital art space, autonomous agents are already changing how content is curated, traded, and displayed. These agents can autonomously acquire and curate digital content based on predefined rules through onchain verification. By operating on a decentralized infrastructure, art curator agents reduce risks such as fraud or manipulation commonly associated with centralized platforms.
Programmable licensing embedded in the metadata of digital art ensures all transactions respect the creator’s terms. This eliminates ambiguities around copyright and guarantees fair compensation for creators, even as their work circulates across different platforms.
Intelligent creative tools
Developers are integrating autonomous agents into creative applications, offering creators powerful tools to enhance their work. These agents can act as co-creators or intelligent managers to generate, refine, and manage content in new ways. For example, an agent embedded in a video editing platform might suggest edits based on audience engagement data or generate metadata to improve discoverability.
The use of trustless, onchain computation means that creators are not reliant on centralized APIs or platforms, which could compromise their data or artistic vision. Unlike many current AI agents that depend on centralized APIs like OpenAI, these decentralized agents operate sustainably and transparently, avoiding vulnerabilities tied to centralized control.
Where to start for creators
For creators just starting to explore decentralized platforms, it is crucial to confirm that the platform they use provides reliable and sustainable storage for their data. Many traditional NFTs store the artwork and metadata separately, which can create issues if the centralized storage provider discontinues service or stops paying for the storage costs. That’s a recipe for future headaches.
Decentralized platforms like Bazar take a different approach, bundling everything together—your work, its rights, and ownership—in one permanent transaction on Arweave, called an atomic asset. Think of it like a self-contained digital artwork that carries its own rule book, no matter where it travels online. This is especially important as AI increasingly interacts with creative work, making the ability to embed programmable licensing rights essential. To that end, Bazar is experimenting with a data licensing framework called the Universal Data License that empowers artists to encode clear usage rules directly into their creations.
When art includes these clear rules about how it can be used, autonomous agents can act like digital rights managers, making sure terms are followed everywhere the work appears. These rules provide transparency for users and AI agents alike, ensuring consistent adherence to terms of use. It’s like having a tireless advocate ensuring creators maintain control over how their work is used, securing credit and compensation even as their art evolves and takes on new life across the digital landscape.
The future of autonomous agents
Over the next decade, autonomous agents will play an increasingly important role in the creator economy. By decentralizing content monetization and distribution, these agents reduce reliance on traditional platforms, providing creators with more tools and resources to maintain control over their work while streamlining business operations. They will also help identify new monetization strategies, intelligently manage distribution, and handle data-driven financial decisions.
Autonomous agents offer an opportunity for creators to regain control over their work and innovate in ways that would be previously constrained by centralized systems. As these tools evolve, they will help build a creator economy that prioritizes transparency, empowerment, and sustainable growth for all.
Read more: AI is the best thing to ever happen to content creators in the web3 era | Opinion
Author: Nick Juliano
Nick Juliano is the lead developer of Bazar Marketplace.
ACT-7.41%
S+3.49%
lagartha
10h
Price analysis 2/21: BTC, ETH, XRP, BNB, SOL, DOGE, ADA, LINK, SUI, XLM
The failure of the bears to sink Bitcoin
BTCUSD
below $93,000 attracted buyers who pushed the price near $99,500 on Feb. 21. The bulls will try to strengthen their position by pushing the price above the psychologically crucial $100,000 level. If they do that, Bitcoin may move toward its all-time high.
When the price settles inside a well-defined range, traders buy near the support and sell close to the resistance. Therefore, buyers may find it difficult to push the price above the all-time high of $109,588.
Significant buying or selling pressure is needed to push the price out of the range, which usually requires a trigger. Until that happens, the price may continue its volatile random price action inside the range.
Dogecoin, Cryptocurrencies, Stellar, Bitcoin Price, XRP, Markets, Cryptocurrency Exchange, Cardano, Price Analysis, Binance Coin, Chainlink, Market Analysis, Ether Price, Solana, Bitcoin ETF, ETF, SUI
Although Bitcoin has been range-bound for several weeks, inflows have continued into spot Bitcoin exchange-traded funds. A post on X by CryptoQuant’s head of research, Julio Moreno, highlighted ETF inflows of $4.3 billion in Q1 2025, compared to $4.8 billion in Q1 2024. However, the analyst added that in Bitcoin terms, the demand is down from 100,000 Bitcoin in 2024 to roughly 41,000 Bitcoin in 2025.
Could Bitcoin surpass the psychological $100,000 resistance, triggering a rally in altcoins? Let’s analyze the charts of the top 10 cryptocurrencies to find out.
Bitcoin price analysis
Bitcoin rose above the 20-day exponential moving average ($97,700) on Feb. 20, indicating that the bulls are trying to seize control.
Dogecoin, Cryptocurrencies, Stellar, Bitcoin Price, XRP, Markets, Cryptocurrency Exchange, Cardano, Price Analysis, Binance Coin, Chainlink, Market Analysis, Ether Price, Solana, Bitcoin ETF, ETF, SUI
The $100,000 level could act as a stiff barrier, but it is likely to be crossed. The
BTCUSDT
pair could surge to $102,500 and thereafter to $106,500. Buyers are expected to face significant resistance in the $106,500 to $109,588 zone.
Time is running out for the bears. If they want to stall the upmove, they will have to quickly yank the price below $93,388. That could clear the path for a retest of the critical $90,000 support. The bulls are expected to defend the $90,000 level with all their might because a break below it will complete a bearish double-top pattern.
Ether price analysis
Buyers pushed Ether
ETHUSD
to the breakdown level of $2,850 on Feb. 21, but the long wick on the candlestick shows solid selling at higher levels.
Dogecoin, Cryptocurrencies, Stellar, Bitcoin Price, XRP, Markets, Cryptocurrency Exchange, Cardano, Price Analysis, Binance Coin, Chainlink, Market Analysis, Ether Price, Solana, Bitcoin ETF, ETF, SUI
If the price remains below the 20-day EMA ($2,777), the bears will again attempt to sink the
ETHUSDT
pair below $2,500. If they can pull it off, the pair could plunge to $2,400 and subsequently to $2,300.
On the contrary, if the price rises above $2,850, the pair could reach the downtrend line. Sellers are expected to defend the downtrend line, but if the bulls prevail, the pair could rally toward $3,400.
XRP price analysis
The bulls pushed XRP
XRPUSD
above the 50-day SMA ($2.72) on Feb. 19, but the bears pulled the price lower on Feb. 20.
Dogecoin, Cryptocurrencies, Stellar, Bitcoin Price, XRP, Markets, Cryptocurrency Exchange, Cardano, Price Analysis, Binance Coin, Chainlink, Market Analysis, Ether Price, Solana, Bitcoin ETF, ETF, SUI
The flattish 20-day EMA ($2.64) and the RSI near the midpoint suggest the
XRPUSDT
pair could remain inside the symmetrical triangle for a while. If the price breaks above the 50-day SMA, the pair could rise to the downtrend line. Conversely, a close below the 20-day EMA could sink the pair to the support line.
The next trending move is likely to begin on a break above or below the triangle. A break above the downtrend line could propel the pair to $3.40, while a slide below the support line may sink the pair to $1.90.
BNB price analysis
Buyers are trying to push BNB
BNBUSD
above the 50-day SMA ($668), indicating solid demand at lower levels.
Dogecoin, Cryptocurrencies, Stellar, Bitcoin Price, XRP, Markets, Cryptocurrency Exchange, Cardano, Price Analysis, Binance Coin, Chainlink, Market Analysis, Ether Price, Solana, Bitcoin ETF, ETF, SUI
The short-term advantage will tilt in favor of the bulls if they push and sustain the price above $686. The
BNBUSDT
pair could climb to $745, which is expected to pose a substantial challenge to the bulls.
If the price turns down sharply from the 50-day SMA, it will signal selling on rallies. The bears will try to pull the price below $650. If they succeed, the pair could dip to $596 and then to $557. That brings the larger $460 to $745 range into play.
Solana price analysis
Buyers have pushed Solana
SOLUSD
above the breakdown level of $175, indicating the start of a relief rally.
Dogecoin, Cryptocurrencies, Stellar, Bitcoin Price, XRP, Markets, Cryptocurrency Exchange, Cardano, Price Analysis, Binance Coin, Chainlink, Market Analysis, Ether Price, Solana, Bitcoin ETF, ETF, SUI
The 20-day EMA ($192) is sloping down, and the RSI is in the negative zone, indicating that bears hold the edge. If the price turns down from the current level or the 20-day EMA, it will indicate selling on rallies. The bears will then attempt to sink the
SOLUSDT
pair to $155.
Contrary to this assumption, a break and close above the 20-day EMA suggests that the markets rejected the break below $175. The pair could climb to the 50-day SMA ($210) and later to $220.
Dogecoin price analysis
Dogecoin
has been stuck between the 20-day EMA ($0.27) and the support line of the descending channel pattern.
Dogecoin, Cryptocurrencies, Stellar, Bitcoin Price, XRP, Markets, Cryptocurrency Exchange, Cardano, Price Analysis, Binance Coin, Chainlink, Market Analysis, Ether Price, Solana, Bitcoin ETF, ETF, SUI
The downsloping 20-day EMA and the RSI in the negative territory indicate an advantage to sellers. The selling could accelerate on a break and close below the support line. There is support at $0.20, but that is likely to be broken. The
DOGEUSDT
pair could then slide to $0.15.
This negative view will be invalidated in the near term if the price turns up and breaks above the 20-day EMA. The pair could then rise to the 50-day SMA ($0.31), which is expected to behave as a strong barrier.
Cardano price analysis
Cardano (ADA) has been witnessing a tough battle between the bulls and the bears near the 20-day EMA ($0.80).
Dogecoin, Cryptocurrencies, Stellar, Bitcoin Price, XRP, Markets, Cryptocurrency Exchange, Cardano, Price Analysis, Binance Coin, Chainlink, Market Analysis, Ether Price, Solana, Bitcoin ETF, ETF, SUI
If buyers push and maintain the price above the 20-day EMA, the
ADAUSDT
pair could rise toward the 50-day SMA ($0.90). That suggests the pair could extend its stay inside the descending channel pattern for some more time. Buyers will gain the upper hand after they propel the price above the resistance line.
On the downside, a break and close below $0.73 could sink the pair to the support line. The bulls are expected to aggressively defend the support line.
Chainlink price analysis
Chainlink (LINK) has risen to the breakdown level of $19.25, indicating that the bulls are attempting to start a recovery.
Dogecoin, Cryptocurrencies, Stellar, Bitcoin Price, XRP, Markets, Cryptocurrency Exchange, Cardano, Price Analysis, Binance Coin, Chainlink, Market Analysis, Ether Price, Solana, Bitcoin ETF, ETF, SUI
The downsloping moving averages and the RSI below 44 suggest that the bears are unlikely to give up easily. If the price turns down sharply from $19.25 and breaks below $17, it will signal that the bears remain in control. The
LINKUSDT
pair could then fall to $15.40.
If buyers want to prevent the fall, they will have to swiftly push the price back above the $19.25 resistance. If they do that, it will suggest that the markets have rejected the breakdown. The pair may rally to the 50-day SMA ($21.49).
Sui price analysis
Sui (SUI) rebounded off the $2.86 support on Feb. 18, indicating that the bulls are trying to form a strong floor at the level.
Dogecoin, Cryptocurrencies, Stellar, Bitcoin Price, XRP, Markets, Cryptocurrency Exchange, Cardano, Price Analysis, Binance Coin, Chainlink, Market Analysis, Ether Price, Solana, Bitcoin ETF, ETF, SUI
If the price maintains above the 20-day EMA ($3.44), the
SUIUSDT
pair could rise to $3.74. This is a crucial resistance to watch out for because a close above $3.74 will complete a short-term double-bottom pattern. There is resistance at the 50-day SMA ($4.05), but if the level is crossed, the pair could rally to the pattern target of $4.62.
Sellers will have to pull the price below the $2.86 support to start a deeper correction to $2.39 and later to $2.20.
Stellar price analysis
Stellar (XLM) is facing selling at the 20-day EMA ($0.34), signaling that the bears continue to sell on minor rallies.
Dogecoin, Cryptocurrencies, Stellar, Bitcoin Price, XRP, Markets, Cryptocurrency Exchange, Cardano, Price Analysis, Binance Coin, Chainlink, Market Analysis, Ether Price, Solana, Bitcoin ETF, ETF, SUI
The $0.31 support is the critical level to watch out for on the downside. A break and close below $0.31 will complete a descending triangle pattern. The
XLMUSDT
pair may then slump to $0.26 and, after that, to $0.20.
Contrarily, a break and close above the 20-day EMA suggests that the selling pressure is reducing. The pair may rise to the 50-day SMA ($0.39) and later to the downtrend line. Sellers are expected to fiercely defend the downtrend line
This article does not contain investment advice or recommendations. Every investment and trading move involves risk, and readers should conduct their own research when making a decision$BNB $BTC $ETC $DOGE $SOL
BTC-0.75%
X-3.91%

Miles_Bitget
10h
Markets don’t just react to events. They emerge, unfold, and manifest from a deeper field of potentiality—one where every possible wave structure exists in probability until sentiment, liquidity, and external forces cause a specific path to materialize.
People often do not understand the underlying forces of market movements beyond simple patterns and fibonacci levels. What we see on the chart is not the market merely responding to news and external events in a linear cause-and-effect fashion. Instead, the market is like a quantum field of probability, where all potential price movements exist in a superposition. The act of sentiment, liquidity, and market structure collapses these possibilities into what we observe as an Elliott Wave formation.
This is why Elliott Wave works—because markets are shaped by deep structural forces, not just surface-level news events. People think price moves because of news. No—price follows a natural unfolding process, shaped by sentiment, liquidity, and probabilistic interference. News is just one of many interferences that can slightly alter the path of an already existing wave structure.
This is the core principle of mastering Elliott Wave. You’re not predicting price—you’re tracking the collapse of probabilistic potential into structured waves.
$ETH
CORE-1.98%
ETH+2.11%
Mga kaugnay na asset
Mga sikat na cryptocurrencies
Isang seleksyon ng nangungunang 8 cryptocurrencies ayon sa market cap.


Kamakailang idinagdag
Ang pinakahuling idinagdag na cryptocurrency.


Maihahambing na market cap
Sa lahat ng asset ng Bitget, ang 8 na ito ang pinakamalapit sa Act I : The AI Prophecy sa market cap.