Bitget: Top 4 in global daily trading volume!
Please also display BTC in AR62.38%
New listings on Bitget : Pi Network
BTC/USDT$82214.31 (+6.31%)Fear at Greed Index18(Extreme fear)
Altcoin season index:0(Bitcoin season)
Coins listed in Pre-MarketBABY,PAWS,WCTTotal spot Bitcoin ETF netflow -$326.3M (1D); -$595.2M (7D).Welcome gift package para sa mga bagong user na nagkakahalaga ng 6200 USDT.Claim now
Trade anumang oras, kahit saan gamit ang Bitget app. I-download ngayon

May kaugnayan sa coin
Price calculator
Kasaysayan ng presyo
Paghula ng presyo
Teknikal na pagsusuri
Gabay sa pagbili ng coin
kategorya ng Crypto
Profit calculator


Pendle presyoPENDLE
Listed
Quote pera:
PHP
₱192.3+18.44%1D
Price chart
TradingView
Last updated as of 2025-04-09 18:53:09(UTC+0)
Market cap:₱31,058,811,083.08
Ganap na diluted market cap:₱31,058,811,083.08
Volume (24h):₱11,206,972,436.12
24h volume / market cap:36.08%
24h high:₱195.22
24h low:₱149.18
All-time high:₱429.66
All-time low:₱1.91
Umiikot na Supply:161,509,780 PENDLE
Total supply:
281,527,448.46PENDLE
Rate ng sirkulasyon:57.00%
Max supply:
--PENDLE
Price in BTC:0.{4}4096 BTC
Price in ETH:0.002051 ETH
Price at BTC market cap:
Price at ETH market cap:
Mga kontrata:
0x0c88...9a8c9e8(Arbitrum)
Higit pa
Ano ang nararamdaman mo tungkol sa Pendle ngayon?
Tandaan: Ang impormasyong ito ay para sa sanggunian lamang.
Presyo ng Pendle ngayon
Ang live na presyo ng Pendle ay ₱192.3 bawat (PENDLE / PHP) ngayon na may kasalukuyang market cap na ₱31.06B PHP. Ang 24 na oras na dami ng trading ay ₱11.21B PHP. Ang presyong PENDLE hanggang PHP ay ina-update sa real time. Ang Pendle ay 18.44% sa nakalipas na 24 na oras. Mayroon itong umiikot na supply ng 161,509,780 .
Ano ang pinakamataas na presyo ng PENDLE?
Ang PENDLE ay may all-time high (ATH) na ₱429.66, na naitala noong 2024-04-11.
Ano ang pinakamababang presyo ng PENDLE?
Ang PENDLE ay may all-time low (ATL) na ₱1.91, na naitala noong 2022-11-09.
Bitcoin price prediction
Kailan magandang oras para bumili ng PENDLE? Dapat ba akong bumili o magbenta ng PENDLE ngayon?
Kapag nagpapasya kung buy o mag sell ng PENDLE, kailangan mo munang isaalang-alang ang iyong sariling diskarte sa pag-trading. Magiiba din ang aktibidad ng pangangalakal ng mga long-term traders at short-term traders. Ang Bitget PENDLE teknikal na pagsusuri ay maaaring magbigay sa iyo ng sanggunian para sa trading.
Ayon sa PENDLE 4 na teknikal na pagsusuri, ang signal ng kalakalan ay Malakas bumili.
Ayon sa PENDLE 1d teknikal na pagsusuri, ang signal ng kalakalan ay Buy.
Ayon sa PENDLE 1w teknikal na pagsusuri, ang signal ng kalakalan ay Neutral.
Ano ang magiging presyo ng PENDLE sa 2026?
Batay sa makasaysayang modelo ng hula sa pagganap ng presyo ni PENDLE, ang presyo ng PENDLE ay inaasahang aabot sa ₱188.17 sa 2026.
Ano ang magiging presyo ng PENDLE sa 2031?
Sa 2031, ang presyo ng PENDLE ay inaasahang tataas ng +2.00%. Sa pagtatapos ng 2031, ang presyo ng PENDLE ay inaasahang aabot sa ₱410.41, na may pinagsama-samang ROI na +161.05%.
Pendle price history (PHP)
The price of Pendle is -47.31% over the last year. The highest price of PENDLE in PHP in the last year was ₱429.66 and the lowest price of PENDLE in PHP in the last year was ₱105.12.
TimePrice change (%) Lowest priceHighest price
Lowest priceHighest price 24h+18.44%₱149.18₱195.22
7d+5.77%₱136.86₱195.22
30d+73.71%₱105.12₱195.22
90d-16.63%₱105.12₱251.07
1y-47.31%₱105.12₱429.66
All-time+68.57%₱1.91(2022-11-09, 2 taon na ang nakalipas )₱429.66(2024-04-11, 364 araw ang nakalipas )
Pendle impormasyon sa merkado
Pendle market
Pendle holdings
Pendle holdings distribution matrix
Pendle holdings by concentration
Whales
Investors
Retail
Pendle addresses by time held
Holders
Cruisers
Traders
Live coinInfo.name (12) price chart

Pendle na mga rating
Mga average na rating mula sa komunidad
4.4
Ang nilalamang ito ay para sa mga layuning pang-impormasyon lamang.
PENDLE sa lokal na pera
1 PENDLE To MXN$70.091 PENDLE To GTQQ25.931 PENDLE To CLP$3,362.051 PENDLE To UGXSh12,416.571 PENDLE To HNLL86.121 PENDLE To ZARR66.51 PENDLE To TNDد.ت10.361 PENDLE To IQDع.د4,404.091 PENDLE To TWDNT$110.481 PENDLE To RSDдин.357.111 PENDLE To DOP$209.591 PENDLE To MYRRM15.131 PENDLE To GEL₾9.261 PENDLE To UYU$144.131 PENDLE To MADد.م.31.971 PENDLE To OMRر.ع.1.31 PENDLE To AZN₼5.721 PENDLE To SEKkr33.821 PENDLE To KESSh435.191 PENDLE To UAH₴138.82
- 1
- 2
- 3
- 4
- 5
Last updated as of 2025-04-09 18:53:09(UTC+0)
Paano Bumili ng Pendle(PENDLE)

Lumikha ng Iyong Libreng Bitget Account
Mag-sign up sa Bitget gamit ang iyong email address/mobile phone number at gumawa ng malakas na password para ma-secure ang iyong account.

Beripikahin ang iyong account
I-verify ang iyong pagkakakilanlan sa pamamagitan ng paglalagay ng iyong personal na impormasyon at pag-upload ng wastong photo ID.

Convert Pendle to PENDLE
Gumamit ng iba't ibang mga pagpipilian sa pagbabayad upang bumili ng Pendle sa Bitget. Ipapakita namin sa iyo kung paano.
Matuto paI-trade ang PENDLE panghabang-buhay na hinaharap
Pagkatapos ng matagumpay na pag-sign up sa Bitget at bumili ng USDT o PENDLE na mga token, maaari kang magsimulang mag-trading ng mga derivatives, kabilang ang PENDLE futures at margin trading upang madagdagan ang iyong inccome.
Ang kasalukuyang presyo ng PENDLE ay ₱192.3, na may 24h na pagbabago sa presyo ng +18.44%. Maaaring kumita ang mga trader sa pamamagitan ng alinman sa pagtagal o pagkukulang saPENDLE futures.
Sumali sa PENDLE copy trading sa pamamagitan ng pagsunod sa mga elite na traders.
Pagkatapos mag-sign up sa Bitget at matagumpay na bumili ng mga token ng USDT o PENDLE, maaari ka ring magsimula ng copy trading sa pamamagitan ng pagsunod sa mga elite na traders.
Pendle balita

Ang 2x Puffer Points na insentibo ay magtatapos sa 00:00 UTC sa Oktubre 19
Bitget•2024-10-16 04:07
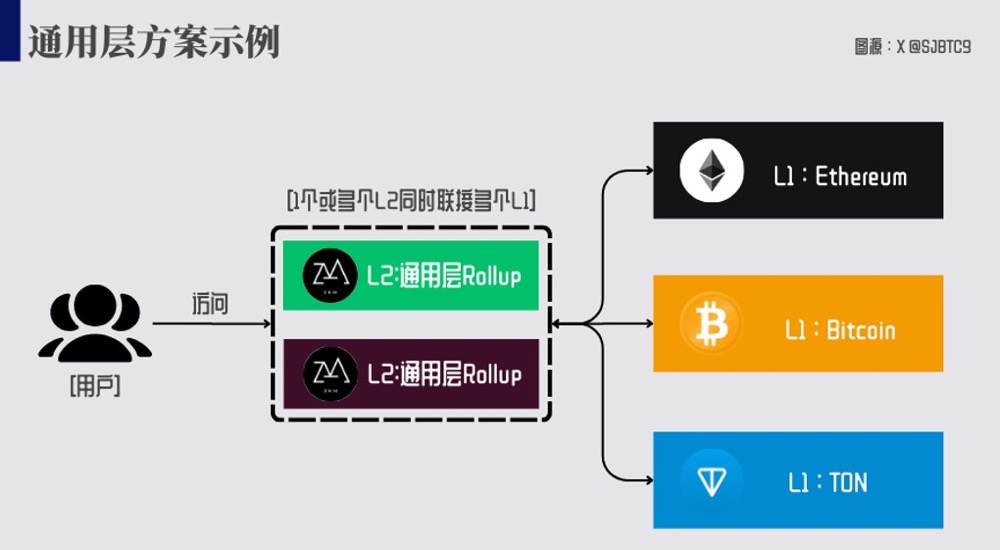
Sa ilalim ng konteksto ng depresyon ng ether, saan ang tagumpay ng Rollup na plano
Eric SJ(重开版)•2024-09-04 03:52
New listings on Bitget
New listings

Buy more


Ang mga tao ay nagtatanong din tungkol sa presyo ng Pendle.
Ano ang kasalukuyang presyo ng Pendle?
The live price of Pendle is ₱192.3 per (PENDLE/PHP) with a current market cap of ₱31,058,811,083.08 PHP. Pendle's value undergoes frequent fluctuations due to the continuous 24/7 activity in the crypto market. Pendle's current price in real-time and its historical data is available on Bitget.
Ano ang 24 na oras na dami ng trading ng Pendle?
Sa nakalipas na 24 na oras, ang dami ng trading ng Pendle ay ₱11.21B.
Ano ang all-time high ng Pendle?
Ang all-time high ng Pendle ay ₱429.66. Ang pinakamataas na presyong ito sa lahat ng oras ay ang pinakamataas na presyo para sa Pendle mula noong inilunsad ito.
Maaari ba akong bumili ng Pendle sa Bitget?
Oo, ang Pendle ay kasalukuyang magagamit sa sentralisadong palitan ng Bitget. Para sa mas detalyadong mga tagubilin, tingnan ang aming kapaki-pakinabang na gabay na Paano bumili ng pendle .
Maaari ba akong makakuha ng matatag na kita mula sa investing sa Pendle?
Siyempre, nagbibigay ang Bitget ng estratehikong platform ng trading, na may mga matatalinong bot sa pangangalakal upang i-automate ang iyong mga pangangalakal at kumita ng kita.
Saan ako makakabili ng Pendle na may pinakamababang bayad?
Ikinalulugod naming ipahayag na ang estratehikong platform ng trading ay magagamit na ngayon sa Bitget exchange. Nag-ooffer ang Bitget ng nangunguna sa industriya ng mga trading fee at depth upang matiyak ang kumikitang pamumuhunan para sa mga trader.
Saan ako makakabili ng Pendle (PENDLE)?
Video section — quick verification, quick trading

How to complete identity verification on Bitget and protect yourself from fraud
1. Log in to your Bitget account.
2. If you're new to Bitget, watch our tutorial on how to create an account.
3. Hover over your profile icon, click on “Unverified”, and hit “Verify”.
4. Choose your issuing country or region and ID type, and follow the instructions.
5. Select “Mobile Verification” or “PC” based on your preference.
6. Enter your details, submit a copy of your ID, and take a selfie.
7. Submit your application, and voila, you've completed identity verification!
Ang mga investment sa Cryptocurrency, kabilang ang pagbili ng Pendle online sa pamamagitan ng Bitget, ay napapailalim sa market risk. Nagbibigay ang Bitget ng madali at convenient paraan para makabili ka ng Pendle, at sinusubukan namin ang aming makakaya upang ganap na ipaalam sa aming mga user ang tungkol sa bawat cryptocurrency na i-eooffer namin sa exchange. Gayunpaman, hindi kami mananagot para sa mga resulta na maaaring lumabas mula sa iyong pagbili ng Pendle. Ang page na ito at anumang impormasyong kasama ay hindi isang pag-endorso ng anumang partikular na cryptocurrency.
PENDLE mga mapagkukunan
Mga tag:
Bitget Insights

BGUSER-RY9UD6C0
2d
PENDLE/USDT
PENDLE+21.64%

Crypto News Flash
3d
Ethena Expands USDe and sUSDe Ecosystem to BNB Chain
Ethena Labs has once again stolen the spotlight with its latest move: bringing its USDe stablecoin and its staking version, sUSDe, to the BNB Chain network. The move allows USDe and sUSDe to be used directly on platforms like PancakeSwap, Venus Protocol, and Pendle—all of which are already familiar to market participants.
This integration allows users to exchange, borrow, and even earn yield on USDe and sUSDe over a network noted for its efficiency and scalability.
For example, on PancakeSwap, the USDe/USDT and sUSDe/USDe pairs are already active and incentivized with Ethena rewards, CAKE token emissions, and fee sharing from pool transactions. It feels like hanging out at a cafe that gives cashback every time you order a drink.
USDe has officially launched on @bnbchain 🔶
USDe and sUSDe go live on @PancakeSwap , @VenusProtocol , and @pendle_fi BNB deployment
Users can swap, lend, and save with Ethena assets on BNB Chain pic.twitter.com/7lNteUrTxs
— Ethena Labs (@ethena_labs) April 4, 2025
On the other hand, CNF previously reported that Ethena Labs also strengthened its financial position by minting an additional $225 million worth of BUIDL tokens from BlackRock. With this addition, Ethena’s total BUIDL holdings now stand at $1.29 billion. It’s not just a number—it reflects growing trust and influence.
A few weeks earlier, BlackRock also announced a partnership with Ethena to build a new network called Converge. This partnership is to pave the way for individual and institutional users to access DeFi more easily, while connecting traditional assets to the crypto world. Think of it as building a direct road from Wall Street to the on-chain world.
It doesn’t stop there; in February 2025, Ethena Labs also managed to secure $100 million in funding through the private sale of ENA tokens. These funds are said to be used to create new products targeting traditional financial institutions. This means that Ethena is not only playing in the retail arena, but is also starting to prepare ammunition for duels at the corporate level.
Seeing this increasingly mature strategy, the market seems quite enthusiastic. At the time of writing, the ENA token was trading at around $0.3217, up around 3.07% in the last 24 hours. While price fluctuations are common in the crypto world, project developments usually drive the movement north.
USDe itself is a synthetic stablecoin that does not rely on traditional fiat reserves. Instead, Ethereum relies on a delta-neutral derivative position against staked Ethereum. So, USDe’s stability does not depend on a central bank or custodian institution. It’s like driving an electric car that doesn’t need to be refueled—more efficient and not dependent on legacy infrastructure.
Meanwhile, sUSDe allows users to earn yields from staking activities and spreads in the derivatives market. For users who like yield farming strategies or passive income, this is certainly an attraction in itself.
ORDER+13.44%
UP+8.52%

HermioneGranger
4d
$PUMP in Action: Real-World DeFi Applications for BTC Holders
$PUMP is transforming Bitcoin into a yield-bearing asset, unlocking new opportunities for BTC holders in the decentralized finance (DeFi) space. Below are its key real-world applications:
Liquid Staking for BTC
- PUMP enables BTC holders to stake their assets through Babylon's trustless staking mechanism while maintaining liquidity. Users receive pumpBTC tokens, representing their staked BTC, which can be used across DeFi platforms without locking funds.
- This liquid staking model allows users to earn rewards while keeping their BTC accessible for trading, lending, or collateralizing other assets.
Multi-Chain DeFi Access
- PumpBTC supports integration across multiple EVM-compatible chains and Layer 2/3 solutions. This enhances Bitcoin’s liquidity and usability, allowing pumpBTC tokens to serve as collateral or liquidity in various protocols.
- Partnerships with platforms like Gearbox and Pendle offer advanced earning strategies, such as leveraging pumpBTC for amplified returns.
Yield Generation and Incentives
- Users earn native rewards through Babylon's staking system, including Babylon Points and PumpBTC Points, which unlock additional benefits and boost long-term yields.
- The system also supports seamless yield generation through automated strategies like compounding interest in the upcoming BTC-fi Yield Vault.
Security and Transparency
- PUMP ensures robust asset security by partnering with custodians like Cobo and Coincover, maintaining a 1:1 backup system for staked BTC. This builds trust and guarantees asset safety.
Flexibility and Accessibility
- Unlike traditional staking methods that lock assets, $PUMP allows users to redeem their pumpBTC for BTC at any time or use it in DeFi applications like lending pools or decentralized exchanges. This flexibility makes it a superior option for BTC holders seeking yield without sacrificing liquidity.
By integrating Bitcoin into Babylon’s ecosystem and offering innovative tools like liquid staking and multi-chain interoperability, PUMP expands Bitcoin’s role in DeFi, providing secure, scal
able, and rewarding pathways for BTC holders.
BTC+7.77%
PENDLE+21.64%

Crypto-Ticker
2025/04/04 18:25
Pendle's 10% Surge: Is This Just the Beginning of a Massive Rally?
The cryptocurrency market has been showing interesting movements lately, with Pendle (PENDLE/USD) catching the attention of traders and investors alike. Currently trading at $3.217, with a 15.21% increase in the past 24 hours, Pendle price has been displaying some compelling price action on its hourly chart. This technical analysis will delve into the recent price movements, key support and resistance levels, and various technical indicators to provide insights into Pendle's potential short to medium-term price trajectory. Understanding these patterns could be crucial for traders looking to capitalize on upcoming movements in this promising token.
Looking at the hourly chart of Pendle/USD from TradingView , we can observe a significant recovery following a sharp decline that bottomed around the $2.75 level. The price has since staged an impressive rebound, forming a series of higher lows and higher highs – a classic sign of a bullish trend. Most notably, Pendle has recently broken above the psychologically important $3.00 level and is currently testing the $3.20-$3.25 resistance zone.
The price action shows a strong upward momentum after a V-shaped recovery. Following the deep correction in early April (April 3rd), buyers stepped in aggressively, leading to a quick reversal and subsequent bullish continuation. The current candle structure shows small-bodied green candles with minimal upper wicks, suggesting that buyers are in control and there's limited selling pressure at current levels. This pattern often precedes further upside movement, especially when combined with supportive technical indicators.
The MA Ribbon displayed on the chart (comprised of SMAs 20, 50, 100, and 200) is providing clear directional cues. Currently, we can observe a bullish alignment with the shorter-term moving averages (20 and 50 SMAs) positioned above the longer-term ones (100 and 200 SMAs). This arrangement, often called the "golden structure," typically indicates strong bullish momentum.
More importantly, the Pendle price has recently crossed above all major moving averages, establishing them as support levels rather than resistance. The 50 SMA (currently around $2.95) appears to be acting as immediate support, followed by the 100 SMA (approximately at $2.85). This moving average support structure provides multiple safety nets for any potential pullbacks, suggesting that dips might be short-lived and present buying opportunities.
The recent bounce from the 200 SMA during the April 3rd sell-off demonstrates its significance as a major support level. The fact that the price respected this long-term moving average further reinforces the overall bullish bias on Pendle's hourly timeframe.
The Accumulation/Distribution Line (ADL) indicator visible at the bottom of the chart provides valuable insights into the underlying buying and selling pressure. The ADL had maintained a relatively stable level throughout late March and early April, suggesting an equilibrium between buyers and sellers. However, we can observe a sharp decline in the ADL coinciding with the recent price recovery, which initially appears counterintuitive.
This divergence between price action and the ADL indicator could be interpreted in multiple ways. One explanation could be that the recent price increase has been driven by a smaller number of larger buyers rather than broad market participation. Alternatively, it might indicate that the current rally is experiencing some distribution (selling into strength), which could potentially lead to a short-term pullback before the next leg up.
However, it's important to note that despite the declining ADL, the price continues to maintain its upward trajectory, suggesting that buying pressure is still outweighing selling pressure in terms of price impact, even if not in terms of volume distribution.
Based on the hourly chart analysis, several key Pendle price levels emerge as significant for Pendle's future movements. Immediate resistance appears at the $3.25-$3.30 zone, which aligns with the recent swing high. A decisive break above this level could trigger a move toward the next resistance at $3.50, potentially followed by a test of the psychological $4.00 level if momentum remains strong.
On the downside, the first major support sits at the $3.00 psychological level, reinforced by the alignment with the 50 SMA. Below that, the $2.85-$2.90 zone (coinciding with the 100 SMA) provides secondary support. The critical support level remains at $2.75, the recent swing low, a breach of which would invalidate the current bullish structure.
The volume profile suggests significant interest around the $3.00 level, making it a crucial battleground for bulls and bears in the coming sessions. The ability of bulls to defend this level during any pullbacks will be instrumental in determining the sustainability of the current uptrend.
Considering the confluence of technical factors – including the bullish price structure, supportive moving averages, and key level analysis – Pendle price appears poised for further upside in the short term. The immediate target is a breakout above $3.30, which could potentially trigger a rally toward the $3.50-$3.60 range.
However, traders should be cautious about the ADL divergence, which suggests some underlying weakness in the current rally. This could manifest as a short-term pullback to retest support levels before continuing higher. Such a pullback, if it occurs, would likely find support at the $3.00-$3.05 zone, presenting a potential buying opportunity with a favorable risk-reward ratio.
For longer-term investors, the overall structure remains constructive as long as Pendle maintains support above the 200 SMA . The token has demonstrated resilience by quickly recovering from the recent correction, indicating strong underlying demand. If Pendle can establish a base above $3.20, it could set the stage for a sustained move toward higher price targets in the coming weeks.
So, Pendle's technical outlook leans bullish with some short-term caution advised. Traders might consider buying dips toward support levels while maintaining appropriate risk management, as the combination of technical factors suggests that the path of least resistance is currently to the upside.
UP+8.52%
MAJOR+5.18%

TheNewsCrypto
2025/04/04 10:05
CRYPTO REPORT OF THE DAY:
Here are the Top 3 Gainers🟢
1️⃣ #Cosmos ( $ATOM )
🔼8.11%
🏷$4.81
2️⃣ #Pendle ( $PENDLE )
🔼3.48%
🏷$3.11
3️⃣ #Nexo ( $NEXO )
🔼2.46%
🏷$1.06
PENDLE+21.64%
NEXO+7.23%
Mga kaugnay na asset
Mga sikat na cryptocurrencies
Isang seleksyon ng nangungunang 8 cryptocurrencies ayon sa market cap.


Kamakailang idinagdag
Ang pinakahuling idinagdag na cryptocurrency.


Pendle Social Data
Sa nakalipas na 24 na oras, ang marka ng sentimento ng social media para sa Pendle ay 5, at ang trend ng presyo ng social media patungo sa Pendle ay Bullish. Ang overall na marka ng social media ng Pendle ay 137, na nagra-rank ng 330 sa lahat ng cryptocurrencies.
Ayon sa LunarCrush, sa nakalipas na 24 na oras, binanggit ang mga cryptocurrencies sa social media nang 1,058,120 (na) beses, na binanggit ang Pendle na may frequency ratio na 0.01%, na nagra-rank ng 246 sa lahat ng cryptocurrencies.
Sa nakalipas na 24 na oras, mayroong total 689 na natatanging user na tumatalakay sa Pendle, na may kabuuang Pendle na pagbanggit ng 118. Gayunpaman, kumpara sa nakaraang 24 na oras, ang bilang ng mga natatanging user bumaba ng 2%, at ang kabuuang bilang ng mga pagbanggit ay bumaba ng 38%.
Sa Twitter, mayroong kabuuang 2 na tweet na nagbabanggit ng Pendle sa nakalipas na 24 na oras. Kabilang sa mga ito, ang 100% ay bullish sa Pendle, 0% ay bearish sa Pendle, at ang 0% ay neutral sa Pendle.
Sa Reddit, mayroong 1 na mga post na nagbabanggit ng Pendle sa nakalipas na 24 na oras. Kung ikukumpara sa nakaraang 24 na oras, ang bilang ng mga pagbanggit bumaba ng 0% . Bukod pa rito, mayroong 0 na komento na nagbabanggit ng Pendle. Kung ikukumpara sa nakaraang 24 na oras, ang bilang ng mga pagbanggit ay bumaba ng 0%.
Lahat ng panlipunang pangkalahatang-ideya
5